
Compare Kalyani Invest. with Similar Stocks
Dashboard
Weak Long Term Fundamental Strength with an average Return on Equity (ROE) of 0.81%
Flat results in Mar 26
With ROE of 0.3, it has a Very Attractive valuation with a 0.2 Price to Book Value
Despite the size of the company, domestic mutual funds hold only 0.01% of the company
Market Beating performance in long term as well as near term
Stock DNA
Non Banking Financial Company (NBFC)
INR 2,355 Cr (Small Cap)
64.00
21
0.00%
0.00
0.32%
0.21
Total Returns (Price + Dividend) 
Kalyani Invest. for the last several years.
Risk Adjusted Returns v/s
Returns Beta

News
Kalyani Investment Company Ltd Upgraded to Hold on Technical and Valuation Improvements
Kalyani Investment Company Ltd has seen its investment rating upgraded from Sell to Hold, reflecting a notable improvement in technical indicators and valuation metrics despite flat recent financial performance. The company’s stock has demonstrated resilience with market-beating returns over multiple time horizons, prompting a reassessment of its investment appeal.
Read full news article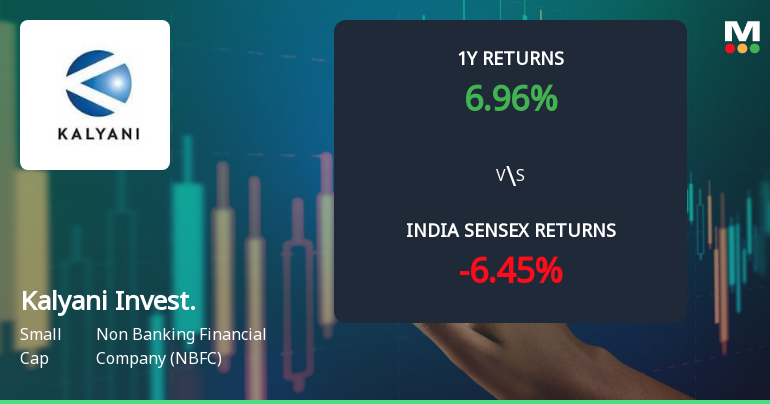
Kalyani Investment Company Ltd Technical Momentum Shifts Signal Bullish Outlook
Kalyani Investment Company Ltd has demonstrated a notable shift in its technical momentum, moving from a mildly bullish stance to a more confident bullish trend. This transition is underscored by a combination of positive signals from key technical indicators such as MACD, Bollinger Bands, and moving averages, suggesting an improving outlook for this small-cap NBFC stock amid a strong price rally.
Read full news article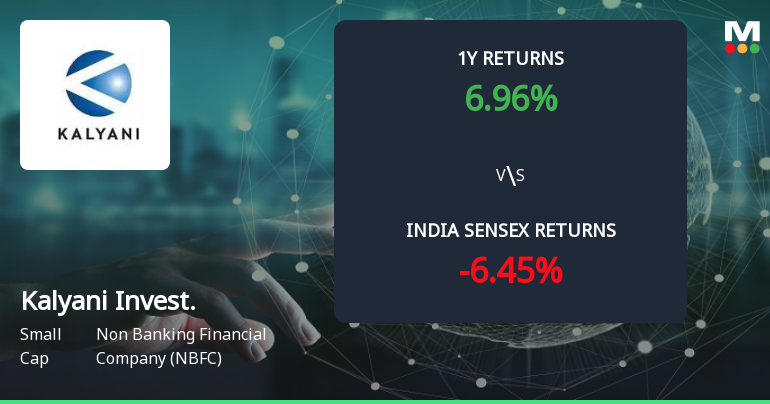
Kalyani Investment Company Ltd Forms Golden Cross Amid Mixed Technical Signals
The 50-day moving average for Kalyani Investment Company Ltd has crossed above the 200-day moving average, signalling a golden cross on 22 Jun 2026. Yet, this technical event arrives amid a complex backdrop of mixed momentum indicators and a small-cap profile, raising questions about the signal’s reliability in isolation.
Read full news article Announcements
Announcement under Regulation 30 (LODR)-Newspaper Publication
18-Jun-2026 | Source : BSEAnnouncement U/R 30 of SEBI LODR-Reminder II regarding Opening of Special Window for Re-lodgement of Physical Transfer and Demat Requests
Announcement under Regulation 30 (LODR)-Newspaper Publication
01-Jun-2026 | Source : BSEAnnouncement U/R 30 of SEBI LODR-Newspaper Publication-Audited Results-31-03-2026
Board Meeting Outcome for Audited Financial Results (Standalone And Consolidated) For The Quarter And Year Ended March 31 2026 & Recommendation Of Dividend For FY 2025-26
29-May-2026 | Source : BSEAudited Financial Results (Standalone and Consolidated) for the quarter and year ended March 31 2026 and Recommendation of Dividend for FY 2025-26
Corporate Actions

No Upcoming Board Meetings

No Dividend history available

No Splits history available

No Bonus history available

No Rights history available
Quality key factors
Valuation key factors
Technicals key factors
 Technical Indicator Scale: Bearish, Mildly Bearish, Sideways, Mildly Bullish, Bullish Turned
 Shareholding Snapshot : Mar 2026
Shareholding Compare (%holding)
Promoters
None
Held by 5 Schemes (0.0%)
Held by 7 FIIs (0.65%)
Sundaram Trading & Investment Private Limited (60.94%)
Oleander Investment Pvt Ltd (1.08%)
18.63%
Quarterly Results Snapshot (Consolidated) - Mar'26 - QoQ

QoQ Growth in quarter ended Mar 2026 is 233.33% vs -85.11% in Dec 2025
QoQ Growth in quarter ended Mar 2026 is 1,029.24% vs -90.97% in Dec 2025
Half Yearly Results Snapshot (Consolidated) - Sep'25

Growth in half year ended Sep 2025 is -2.83% vs 21.35% in Sep 2024
Growth in half year ended Sep 2025 is -63.06% vs 22.53% in Sep 2024
Nine Monthly Results Snapshot (Consolidated) - Dec'25
YoY Growth in nine months ended Dec 2025 is -0.93% vs 22.06% in Dec 2024
YoY Growth in nine months ended Dec 2025 is -61.94% vs 12.21% in Dec 2024
Annual Results Snapshot (Consolidated) - Mar'26
YoY Growth in year ended Mar 2026 is -0.22% vs 17.08% in Mar 2025
YoY Growth in year ended Mar 2026 is -48.60% vs 2.13% in Mar 2025
About Kalyani Investment Company Ltd

Company Coordinates


