
Compare Bayer CropSci. with Similar Stocks
Stock DNA
Pesticides & Agrochemicals
INR 18,939 Cr (Small Cap)
27.00
29
2.97%
-0.19
22.07%
6.05
Total Returns (Price + Dividend) 
Latest dividend: 89.9326941322231 per share ex-dividend date: Nov-14-2025
Risk Adjusted Returns v/s
Returns Beta

News
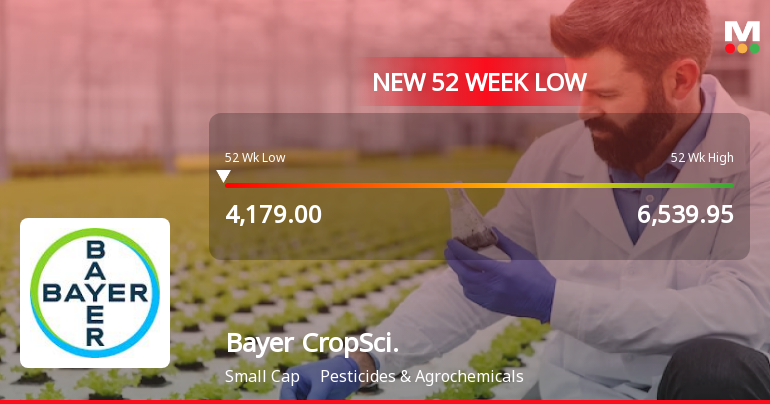
Bayer CropScience Ltd Falls to 52-Week Low of Rs 4179 as Sell-Off Deepens
For the fifth consecutive session, Bayer CropScience Ltd closed lower, slipping to a fresh 52-week low of Rs 4179 on 22 Jun 2026, marking a significant 36% decline from its 52-week high of Rs 6539.95. This downturn contrasts sharply with the broader market's resilience, as the Sensex gained 0.55% and continues a three-week rally.
Read full news article
Bayer CropScience Ltd is Rated Sell
Bayer CropScience Ltd is rated 'Sell' by MarketsMOJO, with this rating last updated on 18 May 2026. While the rating change occurred on that date, the analysis and financial metrics discussed here reflect the stock's current position as of 21 June 2026, providing investors with an up-to-date perspective on the company’s standing.
Read full news article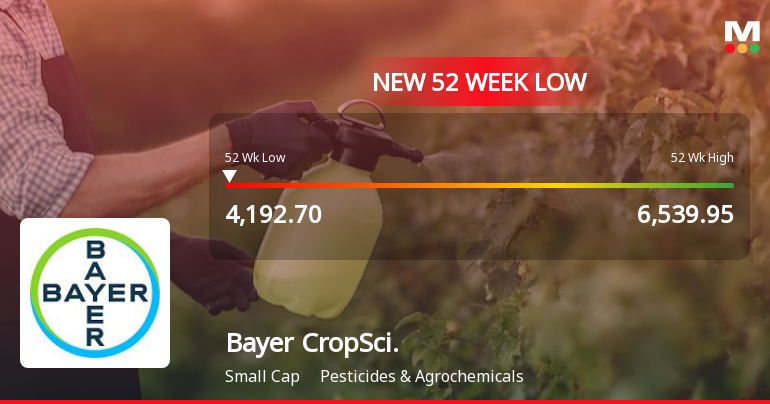
Bayer CropScience Ltd Falls to 52-Week Low of Rs 4,192.7 as Sell-Off Deepens
For the second consecutive session, Bayer CropScience Ltd has declined, hitting a fresh 52-week low of Rs 4,192.7 on 17 Jun 2026, marking a 2.01% drop over the last two days amid broader sector weakness.
Read full news article Announcements
Closure of Trading Window
18-Jun-2026 | Source : BSEPursuant to SEBI (PIT) Regulations 2015 and the Prohibition of Insider Trading Policy of the Company shall be closed for all the designated persons of the Company from July 1 2027 and the same shall remain closed till the declaration of quarterly financial results for the quarter ended June 30 2026 and two days thereafter.
Announcement under Regulation 30 (LODR)-Newspaper Publication
28-May-2026 | Source : BSEIn terms of Regulation 47 of SEBI Listing Regulations 2015 please find attached the newspaper publication for the audited financial results of the Company for the financial year ended March 31 2026.
Compliances-Reg.24(A)-Annual Secretarial Compliance
27-May-2026 | Source : BSEAttached Annual Secretarial Compliance Report for the financial year ended March 31 2026.
Corporate Actions

No Upcoming Board Meetings

Bayer CropScience Ltd has declared 900% dividend, ex-date: 14 Nov 25

No Splits history available

No Bonus history available

No Rights history available
Quality key factors
Valuation key factors
Technicals key factors
 Technical Indicator Scale: Bearish, Mildly Bearish, Sideways, Mildly Bullish, Bullish Turned
 Shareholding Snapshot : Mar 2026
Shareholding Compare (%holding)
Promoters
None
Held by 26 Schemes (9.05%)
Held by 144 FIIs (3.89%)
Bayer Vapi Private Limited (17.89%)
Quant Mutual Fund - Quant Small Cap Fund (2.31%)
8.41%
Quarterly Results Snapshot (Standalone) - Mar'26 - YoY

YoY Growth in quarter ended Mar 2026 is 5.20% vs 32.07% in Mar 2025
YoY Growth in quarter ended Mar 2026 is 13.12% vs 49.27% in Mar 2025
Half Yearly Results Snapshot (Standalone) - Sep'25

Growth in half year ended Sep 2025 is 2.94% vs 0.36% in Sep 2024
Growth in half year ended Sep 2025 is 10.47% vs -29.18% in Sep 2024
Nine Monthly Results Snapshot (Standalone) - Dec'25
YoY Growth in nine months ended Dec 2025 is 3.34% vs 2.66% in Dec 2024
YoY Growth in nine months ended Dec 2025 is 24.11% vs -34.10% in Dec 2024
Annual Results Snapshot (Standalone) - Mar'26
YoY Growth in year ended Mar 2026 is 3.68% vs 7.19% in Mar 2025
YoY Growth in year ended Mar 2026 is 21.34% vs -23.30% in Mar 2025
About Bayer CropScience Ltd

Company Coordinates


