
Compare Sharda Cropchem with Similar Stocks
Dashboard
The company is Net-Debt Free
Healthy long term growth as Operating profit has grown by an annual rate 23.07%
With a growth in Net Profit of 56.54%, the company declared Outstanding results in Mar 26
With ROE of 21.7, it has a Very Attractive valuation with a 2.6 Price to Book Value
Company is among the highest 1% of companies rated by MarketsMojo across all 4,000 stocks
Market Beating Performance
Stock DNA
Pesticides & Agrochemicals
INR 8,289 Cr (Small Cap)
12.00
28
1.34%
-0.19
21.71%
2.57
Total Returns (Price + Dividend) 
Latest dividend: 6 per share ex-dividend date: Feb-06-2026
Risk Adjusted Returns v/s
Returns Beta

News

Sharda Cropchem Ltd Upgraded to Strong Buy on Robust Financials and Improved Technicals
Sharda Cropchem Ltd, a prominent player in the Pesticides & Agrochemicals sector, has seen its investment rating upgraded from Buy to Strong Buy by MarketsMojo as of 6 July 2026. This upgrade reflects a comprehensive reassessment across four critical parameters: Quality, Valuation, Financial Trend, and Technicals, underscoring the company’s robust fundamentals and improving market signals.
Read full news article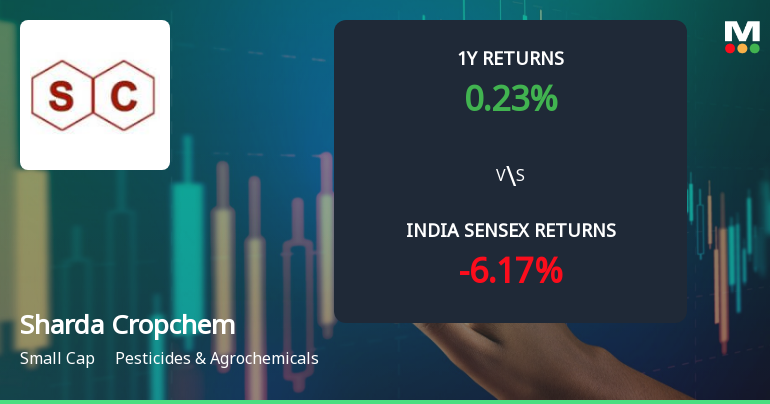
Sharda Cropchem Ltd Technical Momentum Shifts Signal Mildly Bullish Outlook
Sharda Cropchem Ltd, a small-cap player in the pesticides and agrochemicals sector, has exhibited a subtle but noteworthy shift in its technical momentum, moving from a sideways trend to a mildly bullish stance. This change is underscored by a combination of technical indicators, including moving averages, MACD, RSI, and Bollinger Bands, which collectively suggest cautious optimism among investors as the stock trades near ₹920.65, up 1.08% on 7 July 2026.
Read full news article
Sharda Cropchem Ltd is Rated Buy
Sharda Cropchem Ltd is rated 'Buy' by MarketsMOJO, with this rating last updated on 19 June 2026. However, the analysis and financial metrics presented here reflect the company’s current position as of 03 July 2026, providing investors with the most up-to-date insight into its performance and outlook.
Read full news article Announcements
Sharda Cropchem Limited - Analysts/Institutional Investor Meet/Con. Call Updates
15-Nov-2019 | Source : NSESharda Cropchem Limited has informed the Exchange regarding Analysts/Institutional Investor Meet/Con. Call Updates
Sharda Cropchem Limited - Resignation
23-Oct-2019 | Source : NSESharda Cropchem Limited has informed the Exchange regarding Resignation of Mr ASHISH LODHA as Chief Financial Officer of the company w.e.f. October 22, 2019.
Sharda Cropchem Limited - Analysts/Institutional Investor Meet/Con. Call Updates
22-Oct-2019 | Source : NSESharda Cropchem Limited has informed the Exchange regarding Analysts/Institutional Investor Meet/Con. Call Updates
Corporate Actions

No Upcoming Board Meetings

Sharda Cropchem Ltd has declared 60% dividend, ex-date: 06 Feb 26

No Splits history available

No Bonus history available

No Rights history available
Quality key factors
Valuation key factors
Technicals key factors
 Technical Indicator Scale: Bearish, Mildly Bearish, Sideways, Mildly Bullish, Bullish Turned
 Shareholding Snapshot : Jun 2026
Shareholding Compare (%holding)
Promoters
None
Held by 9 Schemes (8.88%)
Held by 95 FIIs (3.11%)
Ashish Ramprakash Bubna (16.83%)
Hdfc Small Cap Fund (7.1%)
9.83%
Quarterly Results Snapshot (Consolidated) - Mar'26 - YoY

YoY Growth in quarter ended Mar 2026 is 12.93% vs 39.36% in Mar 2025

YoY Growth in quarter ended Mar 2026 is 56.53% vs 41.89% in Mar 2025
Half Yearly Results Snapshot (Consolidated) - Sep'25
Growth in half year ended Sep 2025 is 22.53% vs 28.19% in Sep 2024
Growth in half year ended Sep 2025 is 211.66% vs 159.94% in Sep 2024
Nine Monthly Results Snapshot (Consolidated) - Dec'25
YoY Growth in nine months ended Dec 2025 is 28.55% vs 34.60% in Dec 2024
YoY Growth in nine months ended Dec 2025 is 259.31% vs 190.35% in Dec 2024
Annual Results Snapshot (Consolidated) - Mar'26
YoY Growth in year ended Mar 2026 is 21.94% vs 36.57% in Mar 2025
YoY Growth in year ended Mar 2026 is 123.69% vs 854.77% in Mar 2025
About Sharda Cropchem Ltd

Company Coordinates


