
Compare Vinyl Chemicals with Similar Stocks
Dashboard
High Management Efficiency with a high ROE of 23.35%
The company is Net-Debt Free
Poor long term growth as Operating profit has grown by an annual rate -3.95% of over the last 5 years
The company has declared Negative results for the last 4 consecutive quarters
With ROE of 12.7, it has a Very Expensive valuation with a 3.5 Price to Book Value
Majority shareholders : Promoters
Consistent Underperformance against the benchmark over the last 3 years
Total Returns (Price + Dividend) 
Latest dividend: 7.024111675126903 per share ex-dividend date: May-22-2026
Risk Adjusted Returns v/s
Returns Beta

News
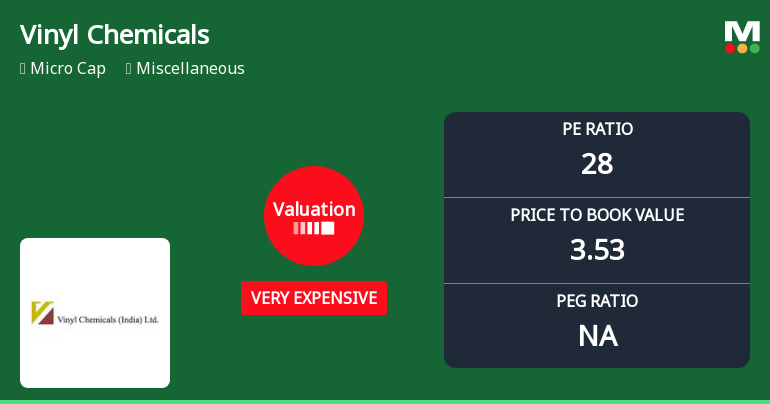
Vinyl Chemicals (I) Ltd Valuation Shifts Signal Heightened Price Risk Amid Mixed Returns
Vinyl Chemicals (I) Ltd has seen a notable shift in its valuation parameters, moving from an expensive to a very expensive rating, despite a mixed performance relative to the Sensex. The company’s price-to-earnings (P/E) and price-to-book value (P/BV) ratios have risen significantly, prompting a reassessment of its price attractiveness in the miscellaneous sector.
Read full news article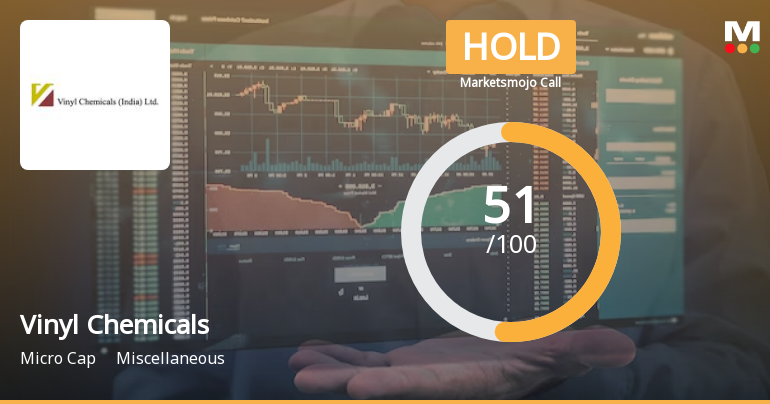
Vinyl Chemicals (I) Ltd is Rated Hold
Vinyl Chemicals (I) Ltd is rated 'Hold' by MarketsMOJO, with this rating last updated on 11 June 2026. However, the analysis and financial metrics presented here reflect the stock's current position as of 15 July 2026, providing investors with an up-to-date view of the company's fundamentals, valuation, financial trends, and technical outlook.
Read full news article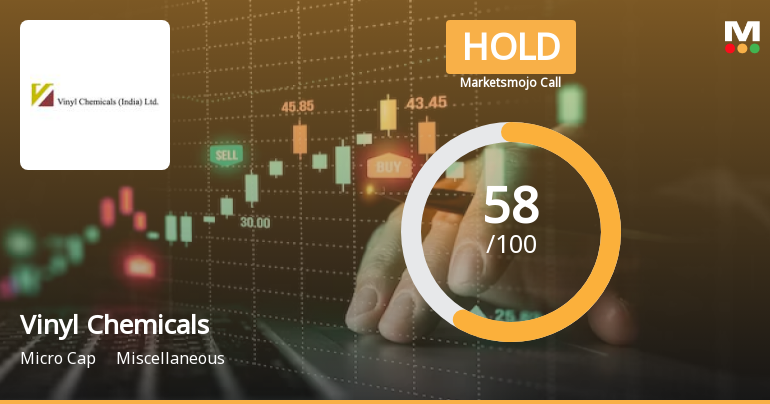
Vinyl Chemicals (I) Ltd is Rated Hold
Vinyl Chemicals (I) Ltd is rated 'Hold' by MarketsMOJO, a rating that was last updated on 11 June 2026. While this rating change occurred recently, the analysis and financial metrics discussed here reflect the stock's current position as of 04 July 2026, providing investors with an up-to-date view of the company's performance and outlook.
Read full news article Announcements
Board Meeting Intimation for Intimation Of Date Of Board Meeting For Consideration Of Unaudited Financial Results For The Quarter Ended 30/06/2026
15-Jul-2026 | Source : BSEVinyl Chemicals (India) Ltdhas informed BSE that the meeting of the Board of Directors of the Company is scheduled on 30/07/2026 inter alia to consider and approve Pursuant to Regulation 29 of the SEBI (Listing Obligations and Disclosure Requirements) Regulations 2015 we wish to inform you that a meeting of the Board of Directors of the Company will be held on Thursday 30th July 2026 inter alia to consider and take on record the Unaudited Financial Results for the First Quarter ended 30th June 2026.
Compliances-Certificate under Reg. 74 (5) of SEBI (DP) Regulations 2018
08-Jul-2026 | Source : BSEAs enclosed
Closure of Trading Window
25-Jun-2026 | Source : BSEIntimation of Trading window Closure
Corporate Actions

30 Jul 2026

Vinyl Chemicals (I) Ltd has declared 700% dividend, ex-date: 22 May 26

No Splits history available

No Bonus history available

No Rights history available
Quality key factors
Valuation key factors
Technicals key factors
 Technical Indicator Scale: Bearish, Mildly Bearish, Sideways, Mildly Bullish, Bullish Turned
 Shareholding Snapshot : Mar 2026
Shareholding Compare (%holding)
Promoters
None
Held by 1 Schemes (0.0%)
Held by 1 FIIs (0.02%)
Pidilite Industries Limited (40.64%)
None
40.66%
Quarterly Results Snapshot (Standalone) - Mar'26 - QoQ

QoQ Growth in quarter ended Mar 2026 is 6.11% vs 11.58% in Dec 2025
QoQ Growth in quarter ended Mar 2026 is 2.88% vs 56.94% in Dec 2025
Half Yearly Results Snapshot (Standalone) - Sep'25
Growth in half year ended Sep 2025 is -0.93% vs 13.44% in Sep 2024
Growth in half year ended Sep 2025 is -27.06% vs 36.18% in Sep 2024
Nine Monthly Results Snapshot (Standalone) - Dec'25
YoY Growth in nine months ended Dec 2025 is 4.47% vs 5.51% in Dec 2024
YoY Growth in nine months ended Dec 2025 is -21.31% vs 5.24% in Dec 2024
Annual Results Snapshot (Standalone) - Mar'26
YoY Growth in year ended Mar 2026 is 4.35% vs 4.73% in Mar 2025
YoY Growth in year ended Mar 2026 is -26.11% vs 2.24% in Mar 2025
About Vinyl Chemicals (I) Ltd

Company Coordinates


