KMG Milk Food

  • Market Cap: Micro Cap
  • Industry: FMCG
  • ISIN: INE873N01015
  • NSEID:
  • BSEID: 519415
INR
50.00
1.64 (3.39%)
BSENSE

May 29

BSE+NSE Vol: 100

  • Price Points
  • Score
  • Mojo Parameters
  • Total Return
  • News and Corporate Actions
  • Key factors
  • Shareholding
  • Financials
  • CompanyCV
stock-summaryPrice Point
High/Low

1Day

52 Week

Valuation
Technical
Day's Volume

CASH

100 (400.00%) Volume

Shareholding (Mar 2026)

FII

0.00%

Held by 0 FIIs

DII

6.88%

Held by 1 DIIs

Promoter

56.77%

how big is KMG Milk Food?

06-Jun-2025

As of Jun 04, KMG Milk Food Ltd has a market capitalization of 20.00 Cr, classifying it as a Micro Cap company, with net sales of 6.77 Cr and a net profit of -0.87 Cr over the latest four quarters. Shareholder's funds are at -0.63 Cr, and total assets amount to 10.75 Cr.

Market Cap: <BR>As of Jun 04, KMG Milk Food Ltd has a market capitalization of 20.00 Cr, classifying it as a Micro Cap company.<BR><BR>Recent Quarterly Performance: <BR>For the latest 4 quarters, KMG Milk Food Ltd reported net sales of 6.77 Cr and a net profit of -0.87 Cr. This data is based on standalone financials.<BR><BR>Balance Sheet Snapshot: <BR>The balance sheet data is standalone and pertains to the reporting period of Mar'24. Shareholder's funds are recorded at -0.63 Cr, while total assets amount to 10.75 Cr.

View full answer

Who are in the management team of KMG Milk Food?

06-Jun-2025

As of March 2022, the management team of KMG Milk Food includes Basudev Garg (Chairman & Wholetime Director), Mithlesh Garg (Director), Prashant Chandra Pande (Independent Director), Santosh Sharma (Director), Arun Kumar Sharma (Independent Director), and Deepti Goel (Company Secretary & Compliance Officer). They are responsible for the company's governance and operational oversight.

As of March 2022, the management team of KMG Milk Food includes the following individuals:<BR><BR>1. Basudev Garg - Chairman & Wholetime Director<BR>2. Mithlesh Garg - Director<BR>3. Prashant Chandra Pande - Independent Director<BR>4. Santosh Sharma - Director<BR>5. Arun Kumar Sharma - Independent Director<BR>6. Deepti Goel - Company Secretary & Compliance Officer<BR><BR>These members play key roles in the governance and operational oversight of the company.

View full answer

Has KMG Milk Food declared dividend?

06-Jun-2025

No Dividend History Available

Who are the peers of the KMG Milk Food?

03-Jun-2025

KMG Milk Food's peers include Hind. Unilever, ITC, Nestle India, Britannia Inds., Godrej Consumer, Mahaan Foods, Tasty Dairy, Paramount Cosmet, and Octavius Plant. Mahaan Foods has the highest 1-year return at 10.66%, while KMG Milk Food's return is 18.00%, significantly outperforming peers like Octavius Plant, which has the lowest return at -36.75%.

Peers: The peers of KMG Milk Food are Hind. Unilever, ITC, Nestle India, Britannia Inds., Godrej Consumer, Mahaan Foods, Tasty Dairy, Paramount Cosmet, Octavius Plant.<BR><BR>Quality Snapshot: Excellent management risk is observed at ITC, Nestle India, and Britannia Inds., while Good management risk is found at Hind. Unilever and Godrej Consumer. Below Average management risk is noted for Tasty Dairy, Paramount Cosmet, and Shanthala, while Average management risk is present at Octavius Plant. Growth is rated as Average for Nestle India, while Below Average growth is seen in Hind. Unilever, ITC, Britannia Inds., Godrej Consumer, and Tasty Dairy, with Mahaan Foods and KMG Milk Food not qualifying. Capital Structure is Excellent for Hind. Unilever, ITC, Nestle India, Britannia Inds., Godrej Consumer, while Below Average is found at Tasty Dairy, Paramount Cosmet, and Shanthala.<BR><BR>Return Snapshot: The peer with the highest 1-year return is Mahaan Foods at 10.66%, while the lowest is Octavius Plant at -36.75%. KMG Milk Food's 1-year return is 18.00%, which is significantly higher than both. Additionally, peers with negative six-month returns include Tasty Dairy, Paramount Cosmet, and Octavius Plant.

View full answer

Is KMG Milk Food overvalued or undervalued?

09-Jun-2025

As of April 25, 2023, KMG Milk Food is considered a risky investment due to its negative financial metrics, including a PE ratio of -21.73 and a return on capital employed of -48.55%, despite a 30.06% stock return over the past year.

As of 25 April 2023, KMG Milk Food's valuation grade has moved from does not qualify to risky, indicating a significant shift in its perceived investment quality. The company appears to be overvalued given its negative PE ratio of -21.73, a price-to-book value of -19.94, and an EV to EBITDA ratio of -13.32. These ratios suggest that the company is struggling financially, particularly with a return on capital employed (ROCE) of -48.55% and negative book value for equity.<BR><BR>In comparison to its peers, KMG Milk Food's valuation metrics are starkly unfavorable. For instance, Altius Telecom, categorized as very attractive, boasts a PE ratio of 52.97, while other peers like Embassy Off.REIT and Inventurus Knowledge show PE ratios of 23.06 and 56.63, respectively. The stark contrast in valuation ratios highlights KMG Milk Food's challenging position in the FMCG sector. Despite recent stock performance showing a return of 30.06% over the past year compared to the Sensex's 7.62%, the underlying financial metrics suggest that the stock is overvalued in the current market context.

View full answer

What is the technical trend for KMG Milk Food?

09-Jun-2025

As of June 6, 2025, KMG Milk Food's technical trend is bullish, supported by positive MACD, moving averages, and Bollinger Bands, despite some short-term weakness indicated by the weekly RSI.

As of 6 June 2025, the technical trend for KMG Milk Food has changed from mildly bullish to bullish. The weekly MACD is bullish, supporting the positive trend, while the daily moving averages also indicate bullish momentum. Bollinger Bands on both weekly and monthly time frames are bullish, further reinforcing the upward sentiment. However, the weekly RSI is bearish, which suggests some short-term weakness. The KST is bullish on the weekly but mildly bearish on the monthly, indicating mixed signals across different time frames. Dow Theory shows a mildly bullish stance on both weekly and monthly charts, and the OBV is mildly bullish as well. Overall, the current technical stance is bullish with moderate strength, driven primarily by the bullish indicators in the MACD, moving averages, and Bollinger Bands.

View full answer

What does KMG Milk Food do?

17-Jul-2025

KMG Milk Food Ltd manufactures and sells dairy products in the FMCG sector. As of March 2025, it reported net sales of 28 Cr and a net loss of 3 Cr, with a market cap of INR 26 Cr.

Overview: <BR>KMG Milk Food Ltd is primarily engaged in the manufacture, purchase, and sales of dairy products and operates within the FMCG industry, classified as a micro-cap company.<BR><BR>History: <BR>KMG Milk Food Limited was incorporated in January 1999. The latest quarterly results reported are for March 2025, showing net sales and profit figures.<BR><BR>Financial Snapshot: <BR>Net Sales: 28 Cr (Quarterly Results - Mar 2025) <BR>Net Profit: -3 Cr (Quarterly Results - Mar 2025) <BR>Market cap: INR 26 Cr (Micro Cap)<BR><BR>Key Metrics: <BR>P/E: N/A <BR>Industry P/E: 32 <BR>Dividend Yield: 0.00% <BR>Debt-Equity: -5.12 <BR>Return on Equity: 79.82% <BR>Price to Book: -23.84<BR><BR>Contact Details: <BR>Address: 9th Kilometer Stone G T Road, Village Masana Kurukshetra Haryana : 132118 <BR>Tel: 91-01744-279452 <BR>Email: compliances.kmg@gmail.com <BR>Website: http://www.kmggroup.com

View full answer

Who are the top shareholders of the KMG Milk Food?

17-Jul-2025

The top shareholder of KMG Milk Food is Basudev Garg, holding 53.47%, with no pledged promoter holdings. The highest public shareholder is Adbantage Advisers India Fund Inc at 4.71%, while individual investors own 23.21%, and mutual funds hold 0.69%.

The top shareholders of KMG Milk Food include the promoters, with Basudev Garg holding the largest share at 53.47%. There are no pledged promoter holdings. Additionally, the highest public shareholder is Adbantage Advisers India Fund Inc, which holds 4.71%. Individual investors collectively own 23.21% of the company. Mutual funds have a small presence, with one scheme holding 0.69%, and there are currently no foreign institutional investors (FIIs) involved.

View full answer

Are KMG Milk Food latest results good or bad?

14-Aug-2025

KMG Milk Food's latest results show a 466% increase in net sales, which is positive, but a 52.63% decline in standalone net profit raises concerns about profitability. Overall, the mixed performance suggests a cautious outlook, with MarketsMOJO issuing a 'Sell' call on the stock.

KMG Milk Food's latest results for the quarter ending March 2025 indicate a mixed performance. On one hand, the company experienced a significant increase in net sales, with a growth of 466% compared to the previous quarter. This is a positive sign, suggesting that the company has managed to boost its sales significantly.<BR><BR>However, the standalone net profit showed a decline of 52.63%, which raises concerns about profitability. This drop in profit, coupled with a flat overall financial performance, suggests that while sales are improving, the company is facing challenges in converting those sales into profit.<BR><BR>Additionally, MarketsMOJO has issued a 'Sell' call on the stock, reflecting a cautious outlook on KMG Milk Food's current performance. Overall, while the increase in sales is encouraging, the decline in profit and the lack of significant growth in other financial metrics indicate that the results could be viewed as more negative than positive. Stakeholders will likely continue to monitor the company's performance closely in this competitive FMCG landscape.

View full answer

How has been the historical performance of KMG Milk Food?

15-Nov-2025

KMG Milk Food has faced ongoing financial challenges, with consistently negative shareholder's funds and total reserves, increasing long-term borrowings, and no profit before tax in the last three years. The company's book value per share declined to -2.04 in March 2025, indicating financial instability.

Answer:<BR>The historical performance of KMG Milk Food shows a trend of negative shareholder's funds and total reserves, indicating ongoing financial challenges. <BR><BR>Breakdown:<BR>KMG Milk Food has consistently reported a share capital of Rs 5.30 crore since March 2020, but total reserves have remained negative, with values ranging from -6.39 crore in March 2025 to -5.93 crore in March 2024. Shareholder's funds have also been negative, decreasing from -0.63 crore in March 2024 to -1.08 crore in March 2025. Long-term borrowings have increased significantly from Rs 0 crore in March 2020 to Rs 7.01 crore in March 2025, with secured loans rising to Rs 5.71 crore in the same period. Total liabilities have shown an upward trend, reaching Rs 9.97 crore in March 2025, while total assets have decreased to Rs 9.97 crore from Rs 10.75 crore in March 2024. The company has not generated profit before tax in the last three years, and cash flow from operating activities has remained negative, indicating ongoing operational difficulties. The book value per share has also declined, reaching -2.04 in March 2025, reflecting the company's financial instability.

View full answer

When is the next results date for KMG Milk Food Ltd?

27-May-2026

The next results date for KMG Milk Food Ltd is 28 May 2026.

The next results date for KMG Milk Food Ltd is scheduled for 28 May 2026.

View full answer

Should I buy, sell or hold KMG Milk Food Ltd?

28-May-2026

Why is KMG Milk Food Ltd falling/rising?

30-May-2026

As of 29-May, KMG Milk Food Ltd's stock price is rising to Rs 50.00, reflecting a 3.39% increase. The stock has shown strong performance, significantly outperforming the Sensex, and is trading close to its 52-week high with increased investor participation.

As of 29-May, KMG Milk Food Ltd's stock price is rising, currently at Rs 50.00, which reflects a change of Rs 1.64 or 3.39%. The stock has shown strong performance over various periods, including a 3.39% increase over the past week and a 4.17% rise year-to-date, significantly outperforming the Sensex, which has declined by 12.26% in the same timeframe. <BR><BR>Today, the stock opened with a gain of 3.39% and reached an intraday high of Rs 50, indicating positive momentum. Additionally, it is trading close to its 52-week high, just 0.98% away from Rs 50.49. The stock has consistently traded above its 5-day, 20-day, 50-day, 100-day, and 200-day moving averages, further indicating a bullish trend.<BR><BR>Moreover, there has been rising investor participation, with delivery volume showing an increase against the 5-day average. This suggests that more investors are willing to hold onto the stock, contributing to its upward price movement. Overall, the combination of strong recent performance, positive trading indicators, and increased investor interest are key factors driving the rise in KMG Milk Food Ltd's stock price.

View full answer
iScoreScore
Click here to find our call on this stock
Strong Sell
Sell
Hold
Buy
Strong Buy

Dashboard

1

With a Negative Book Value, the company has a Weak Long Term Fundamental Strength

  • Poor long term growth as Net Sales has grown by an annual rate of 64.29% and Operating profit at 0.34% over the last 5 years
  • The company has a negative book value of Rs 1.09 crore
2

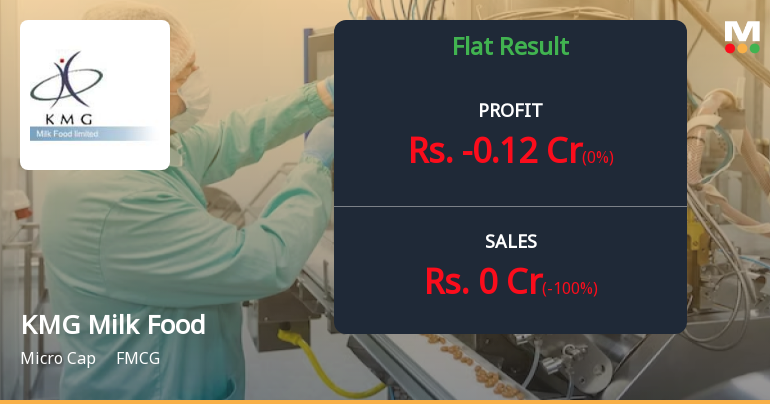
Flat results in Mar 26

3

Risky - Negative EBITDA

stock-summaryMojo Parameters

Mojo Parameters

Loading Valuation Snapshot...

Stock DNA

stock-summary
Industry

FMCG

stock-summary
Market cap

INR 26 Cr (Micro Cap)

stock-summary
P/E

530.00

stock-summary
Industry P/E

32

stock-summary
Dividend Yield

0.00%

stock-summary
Debt Equity

-5.12

stock-summary
Return on Equity

26.61%

stock-summary
Price to Book

-23.53

Revenue and Profits:
Net Sales:
(Quarterly Results - Mar 2026)
Net Profit:
0 Cr
stock-summaryTotal Returns
Total Returns (Price + Dividend) stock-summary
Dividend Yield (0%)
TimePeriod
Price Return
Dividend Return
Total Return
3 Months
8.55%
0%
8.55%
6 Months
4.17%
0%
4.17%
1 Year
46.41%
0%
46.41%
2 Years
58.73%
0%
58.73%
3 Years
50.06%
0%
50.06%
4 Years
138.1%
0%
138.1%
5 Years
191.55%
0%
191.55%

KMG Milk Food for the last several years.

Risk Adjusted Returns v/s stock-summary
Returns Beta
Icon
Beta has not been calculated since enough price history is not available
stock-summaryNews & Corporate Actions

Announcements stock-summary

Board Meeting Intimation for Adjournment Of Board Meeting Under Regulation 29 And 33 Of SEBI (Listing Obligations And Disclosure Requirements) Regulations 2015

26-May-2026 | Source : BSE

KMG Milk Food Ltdhas informed BSE that the meeting of the Board of Directors of the Company is scheduled on 28/05/2026 inter alia to consider and approve 1. To consider and take on record the Audited Financial Results of the Company for the Quarter and Financial Year ended March 31 2026; 2. To consider any other matter with the permission of the Chair

Board Meeting Intimation for APRPOVAL OF AUDITED FINANCIAL STATEMENTS FOR THE YEAR ENDED 31.03.2026

19-May-2026 | Source : BSE

KMG Milk Food Ltdhas informed BSE that the meeting of the Board of Directors of the Company is scheduled on 26/05/2026 inter alia to consider and approve In pursuance of Regulation 29 and 33 of SEBI Listing Regulations 2015 (LODR) this is to inform you that the meeting of the Board of Directors of the Company is scheduled to be held on Tuesday26th May 2026 at 1:00 pm at the registered office of the company at 9th Kilometer Stone Pipli To Ambala Village Masana Kurukshetra Haryana- 132118 1. to inter-alia consider and take on record the Audited Financial Results for the Year ended & Quarter ended March 31 2026 2. to inter-alia consider and take on record any other matter with the permission of Board.

Compliances-Certificate under Reg. 74 (5) of SEBI (DP) Regulations 2018

13-Apr-2026 | Source : BSE

Compliances - Certificate under Reg. 74(5) of SEBI (DP) Regulations

Corporate Actions stock-summary

stock-summary
BOARD MEETING

No Upcoming Board Meetings

stock-summary
DIVIDEND

No Dividend history available

stock-summary
SPLITS

No Splits history available

stock-summary
BONUS

No Bonus history available

stock-summary
RIGHTS

No Rights history available

stock-summaryKey Factors

Quality key factors stock-summary

Factor
Value
Sales Growth (5y)
-8.83%
EBIT Growth (5y)
6.81%
EBIT to Interest (avg)
0
Debt to EBITDA (avg)
Negative Net Debt
Net Debt to Equity (avg)
-5.12
Sales to Capital Employed (avg)
0
Tax Ratio
Tax Ratio is Negative%
Dividend Payout Ratio
0
Pledged Shares
0
Institutional Holding
6.88%
ROCE (avg)
-55.42%
ROE (avg)
0

Valuation key factors

Factor
Value
P/E Ratio
530
Industry P/E
32
Price to Book Value
-24.33
EV to EBIT
-32.10
EV to EBITDA
-32.10
EV to Capital Employed
7.15
EV to Sales
6.83
PEG Ratio
5.06
Dividend Yield
NA
ROCE (Latest)
-60.58%
ROE (Latest)
Negative BV

Technicals key factors

Indicator
Weekly
Monthly
MACD
Bullish
Bullish
RSI
No Signal
No Signal
Bollinger Bands
Bullish
Bullish
Moving Averages
Bullish (Daily)
KST
Bullish
Bullish
Dow Theory
Mildly Bullish
Mildly Bullish
OBV
No Trend
No Trend
stock-summary Technical Indicator Scale: Bearish, Mildly Bearish, Sideways, Mildly Bullish, Bullish  Turned 
stock-summaryShareholding
Shareholding Snapshot : Mar 2026stock-summary
Shareholding Compare (%holding) stock-summary
Majority shareholders

Promoters

Pledged Promoter Holdings

None

Mutual Funds

Held by 1 Schemes (0.69%)

FIIs

Held by 0 FIIs

Promoter with highest holding

Basudev Garg (53.47%)

Highest Public shareholder

Sandeep Gupta (3.61%)

Individual Investors Holdings

23.25%

stock-summaryFinancial
[
  {
    "link": "quarterly",
    "btn_text": "All Quarterly Results",
    "header": "Quarterly Results Snapshot (Standalone) - Mar'26 - QoQ",
    "rhs": [
      {
        "prefix": "Net Sales ",
        "suffix": "QoQ Growth in quarter ended Mar 2026 is -100.00% vs -65.57% in Dec 2025",
        "dir": -1
      },
      {
        "prefix": "Standalone Net Profit ",
        "suffix": "QoQ Growth in quarter ended Mar 2026 is 0.00% vs -20.00% in Dec 2025",
        "dir": 1
      }
    ],
    "table": {
      "header": [
        "Mar'26",
        "Dec'25",
        "Change(%)"
      ],
      "body": [
        {
          "field": "Net Sales",
          "val1": "0.00",
          "val2": "0.42",
          "chgp": "-100.00%",
          "chgp_class": "negative"
        },
        {
          "field": "Operating Profit (PBDIT) excl Other Income",
          "val1": "-0.14",
          "val2": "-0.23",
          "chgp": "39.13%",
          "chgp_class": "positive"
        },
        {
          "field": "Interest",
          "val1": "0.11",
          "val2": "0.11",
          "chgp": "",
          "chgp_class": "neutral"
        },
        {
          "field": "Exceptional Items",
          "val1": "0.00",
          "val2": "0.00",
          "chgp": "",
          "chgp_class": "neutral"
        },
        {
          "field": "Standalone Net Profit",
          "val1": "-0.12",
          "val2": "-0.12",
          "chgp": "",
          "chgp_class": "neutral"
        },
        {
          "field": "Operating Profit Margin (Excl OI)",
          "val1": "0.00%",
          "val2": "-54.76%",
          "chgp": "54.76%",
          "chgp_class": "positive"
        }
      ]
    }
  },
  {
    "link": "half-yearly",
    "btn_text": "All Half Yearly Results",
    "header": "Half Yearly Results Snapshot (Standalone) - Sep'25",
    "rhs": [
      {
        "prefix": "Net Sales ",
        "suffix": " Growth in half year ended Sep 2025 is 24.13% vs 1,174.07% in Sep 2024",
        "dir": -1
      },
      {
        "prefix": "Standalone Net Profit ",
        "suffix": " Growth in half year ended Sep 2025 is 171.79% vs -69.57% in Sep 2024",
        "dir": 1
      }
    ],
    "table": {
      "header": [
        "Sep'25",
        "Sep'24",
        "Change(%)"
      ],
      "body": [
        {
          "field": "Net Sales",
          "val1": "4.27",
          "val2": "3.44",
          "chgp": "24.13%",
          "chgp_class": "positive"
        },
        {
          "field": "Operating Profit (PBDIT) excl Other Income",
          "val1": "0.09",
          "val2": "-1.55",
          "chgp": "105.81%",
          "chgp_class": "positive"
        },
        {
          "field": "Interest",
          "val1": "0.23",
          "val2": "0.23",
          "chgp": "",
          "chgp_class": "neutral"
        },
        {
          "field": "Exceptional Items",
          "val1": "0.00",
          "val2": "0.00",
          "chgp": "",
          "chgp_class": "neutral"
        },
        {
          "field": "Standalone Net Profit",
          "val1": "0.28",
          "val2": "-0.39",
          "chgp": "171.79%",
          "chgp_class": "positive"
        },
        {
          "field": "Operating Profit Margin (Excl OI)",
          "val1": "2.11%",
          "val2": "-45.06%",
          "chgp": "47.17%",
          "chgp_class": "positive"
        }
      ]
    }
  },
  {
    "link": "nine-monthly",
    "btn_text": "All Nine Monthly Results",
    "header": "Nine Monthly Results Snapshot (Standalone) - Dec'25",
    "rhs": [
      {
        "prefix": "Net Sales ",
        "suffix": "YoY Growth in nine months ended Dec 2025 is 19.04% vs 425.33% in Dec 2024",
        "dir": -1
      },
      {
        "prefix": "Standalone Net Profit ",
        "suffix": "YoY Growth in nine months ended Dec 2025 is 127.59% vs -346.15% in Dec 2024",
        "dir": 1
      }
    ],
    "table": {
      "header": [
        "Dec'25",
        "Dec'24",
        "Change(%)"
      ],
      "body": [
        {
          "field": "Net Sales",
          "val1": "4.69",
          "val2": "3.94",
          "chgp": "19.04%",
          "chgp_class": "positive"
        },
        {
          "field": "Operating Profit (PBDIT) excl Other Income",
          "val1": "-0.14",
          "val2": "-1.78",
          "chgp": "92.13%",
          "chgp_class": "positive"
        },
        {
          "field": "Interest",
          "val1": "0.34",
          "val2": "0.36",
          "chgp": "-5.56%",
          "chgp_class": "positive"
        },
        {
          "field": "Exceptional Items",
          "val1": "0.00",
          "val2": "0.00",
          "chgp": "",
          "chgp_class": "neutral"
        },
        {
          "field": "Standalone Net Profit",
          "val1": "0.16",
          "val2": "-0.58",
          "chgp": "127.59%",
          "chgp_class": "positive"
        },
        {
          "field": "Operating Profit Margin (Excl OI)",
          "val1": "-2.99%",
          "val2": "-45.18%",
          "chgp": "42.19%",
          "chgp_class": "positive"
        }
      ]
    }
  },
  {
    "link": "annual",
    "btn_text": "All Annual Results",
    "header": "Annual Results Snapshot (Standalone) - Mar'26",
    "rhs": [
      {
        "prefix": "Net Sales ",
        "suffix": "YoY Growth in year ended Mar 2026 is -30.72% vs 247.18% in Mar 2025",
        "dir": -1
      },
      {
        "prefix": "Standalone Net Profit ",
        "suffix": "YoY Growth in year ended Mar 2026 is 108.70% vs -518.18% in Mar 2025",
        "dir": 1
      }
    ],
    "table": {
      "header": [
        "Mar'26",
        "Mar'25",
        "Change(%)"
      ],
      "body": [
        {
          "field": "Net Sales",
          "val1": "4.69",
          "val2": "6.77",
          "chgp": "-30.72%",
          "chgp_class": "negative"
        },
        {
          "field": "Operating Profit (PBDIT) excl Other Income",
          "val1": "-0.23",
          "val2": "-0.81",
          "chgp": "71.60%",
          "chgp_class": "positive"
        },
        {
          "field": "Interest",
          "val1": "0.46",
          "val2": "0.48",
          "chgp": "-4.17%",
          "chgp_class": "positive"
        },
        {
          "field": "Exceptional Items",
          "val1": "0.00",
          "val2": "0.00",
          "chgp": "",
          "chgp_class": "neutral"
        },
        {
          "field": "Standalone Net Profit",
          "val1": "0.04",
          "val2": "-0.46",
          "chgp": "108.70%",
          "chgp_class": "positive"
        },
        {
          "field": "Operating Profit Margin (Excl OI)",
          "val1": "-4.90%",
          "val2": "-11.96%",
          "chgp": "7.06%",
          "chgp_class": "positive"
        }
      ]
    }
  }
]

Quarterly Results Snapshot (Standalone) - Mar'26 - QoQstock-summary

Mar'26
Dec'25
Change(%)
Net Sales
0.00
0.42
-100.00%
Operating Profit (PBDIT) excl Other Income
-0.14
-0.23
39.13%
Interest
0.11
0.11
Exceptional Items
0.00
0.00
Standalone Net Profit
-0.12
-0.12
Operating Profit Margin (Excl OI)
0.00%
-54.76%
54.76%
Values in Rs Cr.
Direction Arrows
Net Sales

QoQ Growth in quarter ended Mar 2026 is -100.00% vs -65.57% in Dec 2025

Direction Arrows
Standalone Net Profit

QoQ Growth in quarter ended Mar 2026 is 0.00% vs -20.00% in Dec 2025

Half Yearly Results Snapshot (Standalone) - Sep'25stock-summary

Sep'25
Sep'24
Change(%)
Net Sales
4.27
3.44
24.13%
Operating Profit (PBDIT) excl Other Income
0.09
-1.55
105.81%
Interest
0.23
0.23
Exceptional Items
0.00
0.00
Standalone Net Profit
0.28
-0.39
171.79%
Operating Profit Margin (Excl OI)
2.11%
-45.06%
47.17%
Values in Rs Cr.
Direction Arrows
Net Sales

Growth in half year ended Sep 2025 is 24.13% vs 1,174.07% in Sep 2024

Direction Arrows
Standalone Net Profit

Growth in half year ended Sep 2025 is 171.79% vs -69.57% in Sep 2024

Nine Monthly Results Snapshot (Standalone) - Dec'25stock-summary

Dec'25
Dec'24
Change(%)
Net Sales
4.69
3.94
19.04%
Operating Profit (PBDIT) excl Other Income
-0.14
-1.78
92.13%
Interest
0.34
0.36
-5.56%
Exceptional Items
0.00
0.00
Standalone Net Profit
0.16
-0.58
127.59%
Operating Profit Margin (Excl OI)
-2.99%
-45.18%
42.19%
Values in Rs Cr.
Direction Arrows
Net Sales

YoY Growth in nine months ended Dec 2025 is 19.04% vs 425.33% in Dec 2024

Direction Arrows
Standalone Net Profit

YoY Growth in nine months ended Dec 2025 is 127.59% vs -346.15% in Dec 2024

Annual Results Snapshot (Standalone) - Mar'26stock-summary

Mar'26
Mar'25
Change(%)
Net Sales
4.69
6.77
-30.72%
Operating Profit (PBDIT) excl Other Income
-0.23
-0.81
71.60%
Interest
0.46
0.48
-4.17%
Exceptional Items
0.00
0.00
Standalone Net Profit
0.04
-0.46
108.70%
Operating Profit Margin (Excl OI)
-4.90%
-11.96%
7.06%
Values in Rs Cr.
Direction Arrows
Net Sales

YoY Growth in year ended Mar 2026 is -30.72% vs 247.18% in Mar 2025

Direction Arrows
Standalone Net Profit

YoY Growth in year ended Mar 2026 is 108.70% vs -518.18% in Mar 2025

stock-summaryCompany CV
About KMG Milk Food Ltd stock-summary
stock-summary
KMG Milk Food Ltd
Micro Cap
FMCG
KMG Milk Food Limited was incorporated in January, 1999. The Company is primarily engaged in manufacture, purchase and sales of Dairy products like ghee, skimmed milk powder, whole milk powder, dairy whitener, lactose and milk. KMG Milk Food had made a dynamic entry in Dairy Industry by establishing ultra modern Milk Processing Plant in northern region of India, which enabled it as a fast sourcing of the raw material.
Company Coordinates stock-summary
Company Details
9th Kilometer Stone G T Road, Village Masana Kurukshetra Haryana : 132118
stock-summary
Tel: 91-01744-279452
stock-summary
compliances.kmg@gmail.com
Registrar Details
Skyline Financial Services Pvt Ltd , D-153/A, 1st Floor, Okhla Industrial Area, Phase - I, New Delhi