
Compare KMG Milk Food with Similar Stocks
Dashboard
With a Negative Book Value, the company has a Weak Long Term Fundamental Strength
- Poor long term growth as Net Sales has grown by an annual rate of -8.83% and Operating profit at 0% over the last 5 years
- The company has a negative book value of Rs 1.09 crore
Flat results in Mar 26
Risky - Not traded in last 10 days
Total Returns (Price + Dividend) 
KMG Milk Food for the last several years.
Risk Adjusted Returns v/s
Returns Beta

News
KMG Milk Food Ltd Downgraded to Sell Amid Mixed Financials and Bullish Technicals
KMG Milk Food Ltd, a micro-cap player in the FMCG sector, has seen its investment rating downgraded to a 'Sell' with a Mojo Score of 40.0 as of 29 May 2026. Despite a recent bullish technical trend, the company’s weak financial fundamentals and valuation concerns have weighed heavily on the rating, signalling caution for investors.
Read full news article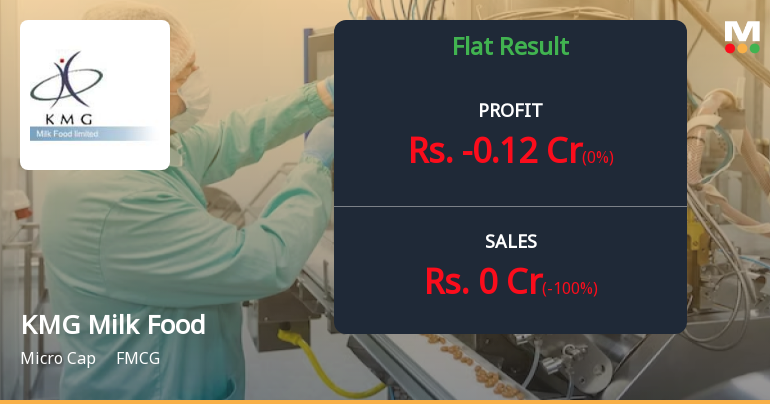
KMG Milk Food Q4 FY26: Operations Collapse as Revenue Plunges to Zero
KMG Milk Food Ltd., a micro-cap dairy products manufacturer with a market capitalisation of ₹26.00 crores, has reported an alarming operational shutdown in Q4 FY26, with net sales collapsing to zero from ₹6.77 crores in Q4 FY25. The company posted a net loss of ₹0.12 crores for the quarter ended March 2026, marking a complete cessation of revenue-generating activities whilst continuing to incur operational costs. The stock, trading at ₹50.00, has gained 46.41% over the past year despite the catastrophic deterioration in business fundamentals.
Read full news article Announcements
Board Meeting Outcome for AUDITED FINANCIAL RESULTS
28-May-2026 | Source : BSEPursuant to Regulation 30 read with Schedule III Part A of SEBI (Listing Obligations and Disclosure Requirements) Regulation 2015 a separate meeting of the Board of Directors was held on 28th May 2026 commenced at 1.30 P.M. and concluded at 5.30 P.M. at the Registered Office of the Company. The Following item in agenda was discussed: 1. Approval of Audited Financial Results for the Quarter and Year ended March 31st 2026: i. Approval of Audited Standalone Financial Results of the Company for the quarter and year ended on March 31 2026. ii. Independent Audit Report issued thereon by the Statutory Auditors of the Company M/s. Gauri Goyal & Associates. Chartered Accountants (MN: 554857) iii. A copy of the said results along with the independent auditor report will be uploaded on the Company website www.kmggroup.com and will also be published in the newspapers in the format prescribed under Regulation 47 of the LODR.
Compliances-Reg.24(A)-Annual Secretarial Compliance
28-May-2026 | Source : BSENON APPLICABILITY CERTIFICATE ATTACHED
Audited Financial Results For The Quarter And Year Ended March 31 2026 (Scrip ID: KMGMILK Scrip Code 519415)
28-May-2026 | Source : BSEAUDITED FINANCIAL RESULTS FOR YEAR ENDING 31.03.2026
Corporate Actions

No Upcoming Board Meetings

No Dividend history available

No Splits history available

No Bonus history available

No Rights history available
Quality key factors
Valuation key factors
Technicals key factors
 Technical Indicator Scale: Bearish, Mildly Bearish, Sideways, Mildly Bullish, Bullish Turned
 Shareholding Snapshot : Mar 2026
Shareholding Compare (%holding)
Promoters
None
Held by 1 Schemes (0.69%)
Held by 0 FIIs
Basudev Garg (53.47%)
Sandeep Gupta (3.61%)
23.25%
Quarterly Results Snapshot (Standalone) - Mar'26 - QoQ

QoQ Growth in quarter ended Mar 2026 is -100.00% vs -65.57% in Dec 2025

QoQ Growth in quarter ended Mar 2026 is 0.00% vs -20.00% in Dec 2025
Half Yearly Results Snapshot (Standalone) - Sep'25
Growth in half year ended Sep 2025 is 24.13% vs 1,174.07% in Sep 2024
Growth in half year ended Sep 2025 is 171.79% vs -69.57% in Sep 2024
Nine Monthly Results Snapshot (Standalone) - Dec'25
YoY Growth in nine months ended Dec 2025 is 19.04% vs 425.33% in Dec 2024
YoY Growth in nine months ended Dec 2025 is 127.59% vs -346.15% in Dec 2024
Annual Results Snapshot (Standalone) - Mar'26
YoY Growth in year ended Mar 2026 is -30.72% vs 247.18% in Mar 2025
YoY Growth in year ended Mar 2026 is 108.70% vs -518.18% in Mar 2025
About KMG Milk Food Ltd

Company Coordinates


