
Compare Sika Interplant with Similar Stocks
Dashboard
Flat results in Mar 26
- PAT(Q) At Rs 7.83 cr has Fallen at -14.6% (vs previous 4Q average)
- NET SALES(Q) Lowest at Rs 41.33 cr
- EPS(Q) Lowest at Rs 3.69
With ROE of 23.5, it has a Very Expensive valuation with a 13.4 Price to Book Value
Despite the size of the company, domestic mutual funds hold only 0% of the company
Underperformed the market in the last 1 year
Stock DNA
Aerospace & Defense
INR 2,290 Cr (Small Cap)
57.00
37
0.24%
-0.19
23.54%
13.43
Total Returns (Price + Dividend) 
Latest dividend: 2.4 per share ex-dividend date: Jul-02-2025
Risk Adjusted Returns v/s
Returns Beta

News
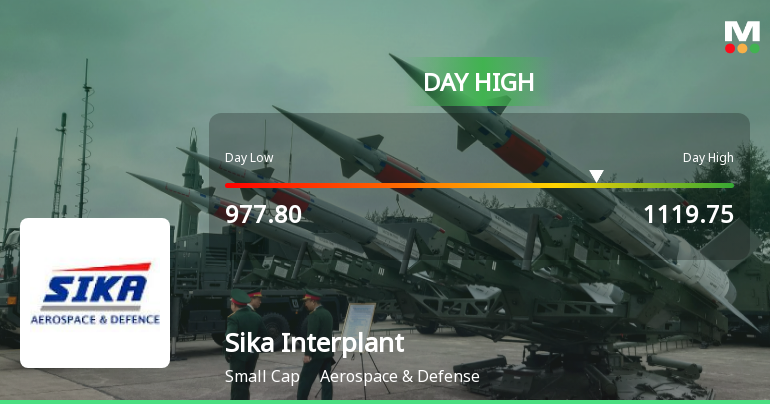
Sika Interplant Systems Ltd Surges 7.12% to Day's High — Outperforms Sensex Despite Sector Lag
While the Sensex declined by 0.92% on 19 Jun 2026, Sika Interplant Systems Ltd surged 7.12%, marking a notable outperformance in a broadly weak market. This 7.12% single-session gain stands out as a significant intraday move, especially given the stock’s recent mixed trend and the Aerospace & Defense sector’s modest performance.
Read full news article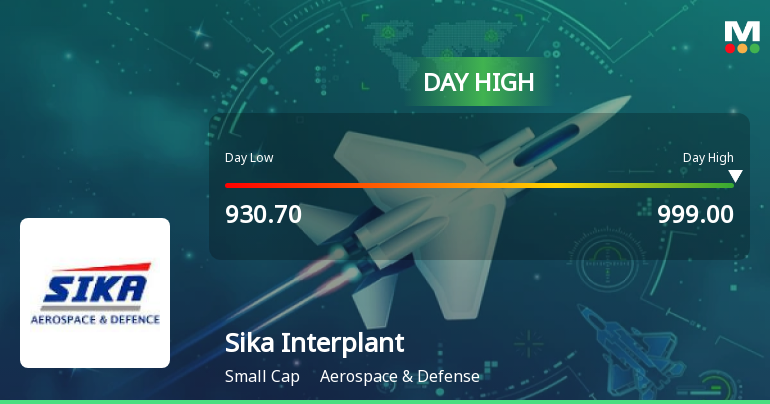
Sika Interplant Systems Ltd Surges 7.63% to Day's High of Rs 978.05 — Outperforms Sector by 5.64 Percentage Points
The Sensex edged up 0.11% on 18 Jun 2026, while Sika Interplant Systems Ltd surged 7.63%, outperforming its Aerospace & Defense sector by 5.64 percentage points. This sharp single-session gain rewrites the short-term narrative for the small-cap stock, which has been on a steady upward trajectory over the past week.
Read full news article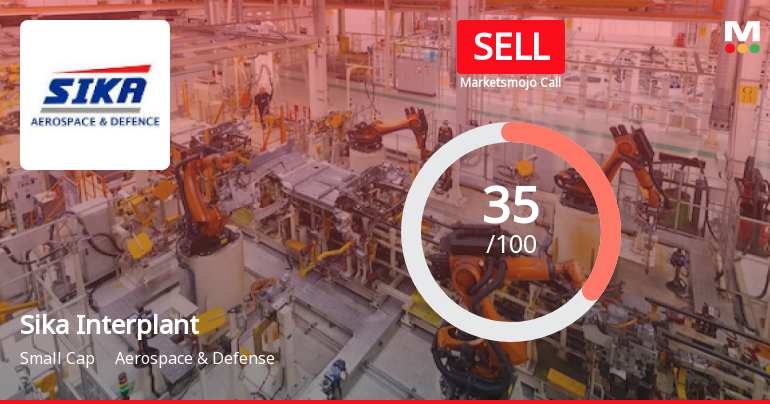
Sika Interplant Systems Ltd is Rated Sell
Sika Interplant Systems Ltd is rated Sell by MarketsMOJO, with this rating last updated on 12 May 2026. However, the analysis and financial metrics discussed here reflect the stock's current position as of 15 June 2026, providing investors with the latest insights into the company’s performance and outlook.
Read full news article Announcements
Compliances-Certificate under Reg. 74 (5) of SEBI (DP) Regulations 2018
05-Jun-2026 | Source : BSECompliances-Certificate under Reg. 74(5) of SEBI (DP)Regulations2018
Compliances-Reg.24(A)-Annual Secretarial Compliance
29-May-2026 | Source : BSECompliances - Reg.24(A)- Annual Secretarial Compliance
Announcement under Regulation 30 (LODR)-Newspaper Publication
15-May-2026 | Source : BSENewspaper Publication
Corporate Actions

No Upcoming Board Meetings

Sika Interplant Systems Ltd has declared 120% dividend, ex-date: 02 Jul 25

Sika Interplant Systems Ltd has announced 2:10 stock split, ex-date: 17 Mar 25

No Bonus history available

No Rights history available
Quality key factors
Valuation key factors
Technicals key factors
 Technical Indicator Scale: Bearish, Mildly Bearish, Sideways, Mildly Bullish, Bullish Turned
 Shareholding Snapshot : Mar 2026
Shareholding Compare (%holding)
Promoters
None
Held by 0 Schemes
Held by 3 FIIs (3.21%)
Ultraweld Engineers Llp (70.1%)
Rimo Capital Fund Lp (2.8%)
20.31%
Quarterly Results Snapshot (Consolidated) - Mar'26 - QoQ

QoQ Growth in quarter ended Mar 2026 is -17.85% vs -2.46% in Dec 2025
QoQ Growth in quarter ended Mar 2026 is -17.49% vs 6.15% in Dec 2025
Half Yearly Results Snapshot (Consolidated) - Sep'25

Growth in half year ended Sep 2025 is 87.86% vs 48.46% in Sep 2024
Growth in half year ended Sep 2025 is 76.31% vs 26.02% in Sep 2024
Nine Monthly Results Snapshot (Consolidated) - Dec'25
YoY Growth in nine months ended Dec 2025 is 67.16% vs 47.56% in Dec 2024
YoY Growth in nine months ended Dec 2025 is 59.00% vs 34.83% in Dec 2024
Annual Results Snapshot (Consolidated) - Mar'26
YoY Growth in year ended Mar 2026 is 43.05% vs 39.26% in Mar 2025
YoY Growth in year ended Mar 2026 is 43.80% vs 30.28% in Mar 2025
About Sika Interplant Systems Ltd

Company Coordinates


