
Compare Sika Interplant with Similar Stocks
Stock DNA
Aerospace & Defense
INR 2,370 Cr (Small Cap)
64.00
38
0.22%
-0.19
23.54%
15.16
Total Returns (Price + Dividend) 
Latest dividend: 2.4 per share ex-dividend date: Jul-02-2025
Risk Adjusted Returns v/s
Returns Beta

News

Sika Interplant Systems Ltd Upgraded to Hold on Technical Improvements and Valuation Concerns
Sika Interplant Systems Ltd has seen its investment rating upgraded from Sell to Hold, reflecting a shift in technical indicators and a stabilisation in financial fundamentals despite recent flat quarterly results. The aerospace and defence small-cap company’s improved technical trend, net-debt free status, and long-term return profile underpin this revised outlook, even as valuation concerns and recent profit dips temper enthusiasm.
Read full news article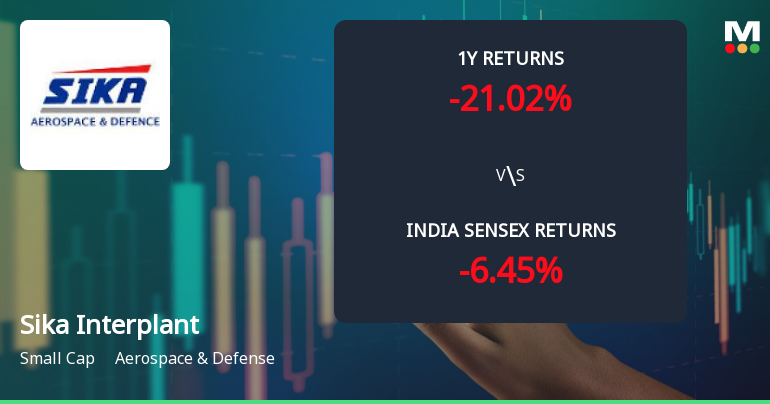
Sika Interplant Systems Ltd Sees Technical Momentum Shift Amid Strong Weekly Gains
Sika Interplant Systems Ltd, a small-cap player in the Aerospace & Defense sector, has demonstrated a notable shift in price momentum and technical indicators, signalling a mild bullish trend after a period of sideways movement. The stock’s recent 6.75% intraday gain and upgrade in technical grading reflect growing investor interest amid mixed but improving technical signals.
Read full news article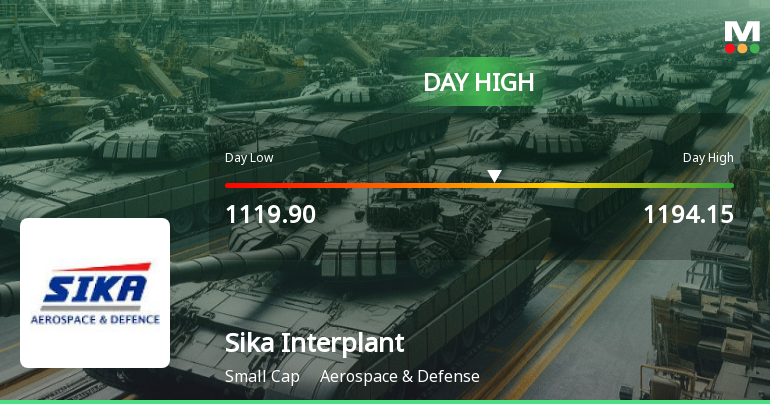
Sika Interplant Systems Ltd Surges 8.0% to Day's High of Rs 1194.15 — Outperforms Sector by 5.83 Percentage Points
The Sensex advanced 0.52% on 22 Jun 2026, yet Sika Interplant Systems Ltd outpaced the broader market with an 8.0% gain, reaching an intraday high of Rs 1194.15. This 5.83 percentage-point outperformance over the Aerospace & Defense sector highlights a distinctly stock-specific rally rather than a general market uplift.
Read full news article Announcements
Clarification sought from Sika Interplant Systems Ltd
23-Jun-2026 | Source : BSEThe Exchange has sought clarification from Sika Interplant Systems Ltd on June 23 2026 with reference to significant movement in price in order to ensure that investors have latest relevant information about the company and to inform the market so that the interest of the investors is safeguarded.
The reply is awaited.
Compliances-Certificate under Reg. 74 (5) of SEBI (DP) Regulations 2018
05-Jun-2026 | Source : BSECompliances-Certificate under Reg. 74(5) of SEBI (DP)Regulations2018
Compliances-Reg.24(A)-Annual Secretarial Compliance
29-May-2026 | Source : BSECompliances - Reg.24(A)- Annual Secretarial Compliance
Corporate Actions

No Upcoming Board Meetings

Sika Interplant Systems Ltd has declared 120% dividend, ex-date: 02 Jul 25

Sika Interplant Systems Ltd has announced 2:10 stock split, ex-date: 17 Mar 25

No Bonus history available

No Rights history available
Quality key factors
Valuation key factors
Technicals key factors
 Technical Indicator Scale: Bearish, Mildly Bearish, Sideways, Mildly Bullish, Bullish Turned
 Shareholding Snapshot : Mar 2026
Shareholding Compare (%holding)
Promoters
None
Held by 0 Schemes
Held by 3 FIIs (3.21%)
Ultraweld Engineers Llp (70.1%)
Rimo Capital Fund Lp (2.8%)
20.31%
Quarterly Results Snapshot (Consolidated) - Mar'26 - QoQ

QoQ Growth in quarter ended Mar 2026 is -17.85% vs -2.46% in Dec 2025
QoQ Growth in quarter ended Mar 2026 is -17.49% vs 6.15% in Dec 2025
Half Yearly Results Snapshot (Consolidated) - Sep'25

Growth in half year ended Sep 2025 is 87.86% vs 48.46% in Sep 2024
Growth in half year ended Sep 2025 is 76.31% vs 26.02% in Sep 2024
Nine Monthly Results Snapshot (Consolidated) - Dec'25
YoY Growth in nine months ended Dec 2025 is 67.16% vs 47.56% in Dec 2024
YoY Growth in nine months ended Dec 2025 is 59.00% vs 34.83% in Dec 2024
Annual Results Snapshot (Consolidated) - Mar'26
YoY Growth in year ended Mar 2026 is 43.05% vs 39.26% in Mar 2025
YoY Growth in year ended Mar 2026 is 43.80% vs 30.28% in Mar 2025
About Sika Interplant Systems Ltd

Company Coordinates


