
Compare Thacker & Co. with Similar Stocks
Stock DNA
Non Banking Financial Company (NBFC)
INR 124 Cr (Micro Cap)
6.00
85
0.00%
-0.01
11.00%
0.69
Total Returns (Price + Dividend) 
Thacker & Co. for the last several years.
Risk Adjusted Returns v/s
Returns Beta

News

Thacker & Company Ltd is Rated Sell
Thacker & Company Ltd is rated Sell by MarketsMOJO, with this rating last updated on 08 June 2026. However, the analysis and financial metrics discussed here reflect the stock’s current position as of 06 July 2026, providing investors with the most up-to-date view of the company’s fundamentals, valuation, financial trends, and technical outlook.
Read full news article
Thacker & Company Ltd is Rated Sell
Thacker & Company Ltd is rated Sell by MarketsMOJO, with this rating last updated on 8 June 2026. However, the analysis and financial metrics discussed below reflect the stock’s current position as of 25 June 2026, providing investors with an up-to-date view of the company’s fundamentals, valuation, financial trends, and technical outlook.
Read full news article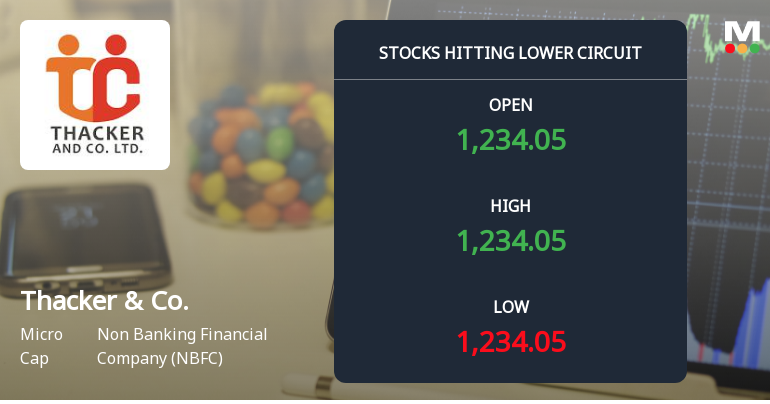
Thacker & Company Ltd Locks at Lower Circuit With 5% Loss — Sellers Queue, No Buyers in Sight
At Rs 1,220.2, sellers were still queuing — but there were no buyers willing to take the other side. Thacker & Company Ltd locked at its lower circuit of 5% on 19 Jun 2026, with unfilled sell orders and a frozen price, signalling a day dominated by supply overwhelming demand.
Read full news article Announcements
Closure of Trading Window
24-Jun-2026 | Source : BSEClosure of Trading Window
Compliances-Reg.24(A)-Annual Secretarial Compliance
29-May-2026 | Source : BSESubmission of Annual Secretarial Compliance Report for the Financial Year 2025-26.
Announcement under Regulation 30 (LODR)-Newspaper Publication
28-May-2026 | Source : BSENewspaper Publication
Corporate Actions

No Upcoming Board Meetings

No Dividend history available

Thacker & Company Ltd has announced 1:5 stock split, ex-date: 24 Jun 14

Thacker & Company Ltd has announced 32:21 bonus issue, ex-date: 16 Jun 17

No Rights history available
Quality key factors
Valuation key factors
Technicals key factors
 Technical Indicator Scale: Bearish, Mildly Bearish, Sideways, Mildly Bullish, Bullish Turned
 Shareholding Snapshot : Mar 2026
Shareholding Compare (%holding)
Promoters
None
Held by 0 Schemes
Held by 0 FIIs
Suma Commercial Private Limited (31.51%)
Bank Of India (7.65%)
11.85%
Quarterly Results Snapshot (Consolidated) - Mar'26 - QoQ

QoQ Growth in quarter ended Mar 2026 is 0.00% vs -40.57% in Dec 2025
QoQ Growth in quarter ended Mar 2026 is 12.89% vs -14.54% in Dec 2025
Half Yearly Results Snapshot (Consolidated) - Sep'25
Growth in half year ended Sep 2025 is 5.75% vs 0.00% in Sep 2024

Growth in half year ended Sep 2025 is -4.40% vs 64.07% in Sep 2024
Nine Monthly Results Snapshot (Consolidated) - Dec'25
YoY Growth in nine months ended Dec 2025 is 2.93% vs 5.71% in Dec 2024
YoY Growth in nine months ended Dec 2025 is -2.77% vs 25.89% in Dec 2024
Annual Results Snapshot (Consolidated) - Mar'26
YoY Growth in year ended Mar 2026 is -9.00% vs 20.11% in Mar 2025
YoY Growth in year ended Mar 2026 is -8.65% vs 15.76% in Mar 2025
About Thacker & Company Ltd

Company Coordinates


