
Compare B2B Soft.Tech. with Similar Stocks
Stock DNA
Software Products
INR 43 Cr (Micro Cap)
15.00
19
2.68%
-1.02
11.30%
1.72
Total Returns (Price + Dividend) 
Latest dividend: 0.66 per share ex-dividend date: Feb-06-2026
Risk Adjusted Returns v/s
Returns Beta

News
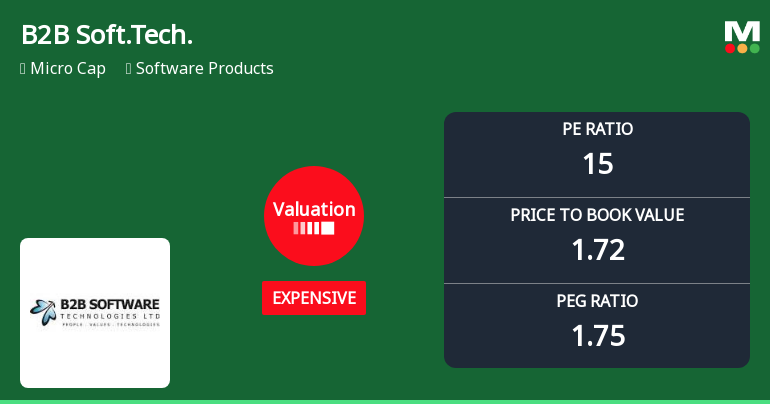
B2B Software Technologies Ltd Valuation Shifts Signal Price Attractiveness Change
B2B Software Technologies Ltd has witnessed a notable shift in its valuation parameters, moving from a fair to an expensive rating. This change, reflected in key metrics such as the price-to-earnings (P/E) and price-to-book value (P/BV) ratios, invites a closer examination of the company’s price attractiveness relative to its historical averages and peer group within the software products sector.
Read full news article
B2B Software Technologies Ltd is Rated Sell
B2B Software Technologies Ltd is rated 'Sell' by MarketsMOJO, with this rating last updated on 11 April 2026. However, the analysis and financial metrics discussed below reflect the stock's current position as of 18 June 2026, providing investors with an up-to-date view of the company’s fundamentals, returns, and technical outlook.
Read full news article
B2B Software Technologies Ltd is Rated Sell
B2B Software Technologies Ltd is rated 'Sell' by MarketsMOJO, with this rating last updated on 11 April 2026. However, the analysis and financial metrics discussed below reflect the stock's current position as of 08 June 2026, providing investors with an up-to-date view of the company's fundamentals, returns, and technical outlook.
Read full news article Announcements
Closure of Trading Window
24-Jun-2026 | Source : BSEClosure of trading window
Announcement under Regulation 30 (LODR)-Award_of_Order_Receipt_of_Order
02-Jun-2026 | Source : BSEReceipt of order
Compliances-Reg.24(A)-Annual Secretarial Compliance
30-May-2026 | Source : BSEAnnual Secretarial Compliance Report for the FY ended 31.03.2026
Corporate Actions

No Upcoming Board Meetings

B2B Software Technologies Ltd has declared 10% dividend, ex-date: 06 Feb 26

No Splits history available

B2B Software Technologies Ltd has announced 1:2 bonus issue, ex-date: 02 Apr 26

No Rights history available
Quality key factors
Valuation key factors
Technicals key factors
 Technical Indicator Scale: Bearish, Mildly Bearish, Sideways, Mildly Bullish, Bullish Turned
 Shareholding Snapshot : Apr 2026
Shareholding Compare (%holding)
Promoters
None
Held by 0 Schemes
Held by 0 FIIs
Nemani Ramachandra Rao (21.22%)
Penmetsa Satyavati Varma (3.81%)
34.81%
Quarterly Results Snapshot (Consolidated) - Mar'26 - YoY

YoY Growth in quarter ended Mar 2026 is 7.49% vs 19.49% in Mar 2025
YoY Growth in quarter ended Mar 2026 is -42.86% vs 3.70% in Mar 2025
Half Yearly Results Snapshot (Consolidated) - Sep'25

Growth in half year ended Sep 2025 is 25.69% vs 19.43% in Sep 2024
Growth in half year ended Sep 2025 is -10.49% vs 210.87% in Sep 2024
Nine Monthly Results Snapshot (Consolidated) - Dec'25
YoY Growth in nine months ended Dec 2025 is 34.65% vs 18.42% in Dec 2024
YoY Growth in nine months ended Dec 2025 is 21.15% vs 58.78% in Dec 2024
Annual Results Snapshot (Consolidated) - Mar'26
YoY Growth in year ended Mar 2026 is 26.18% vs 18.80% in Mar 2025
YoY Growth in year ended Mar 2026 is 7.98% vs 42.16% in Mar 2025
About B2B Software Technologies Ltd

Company Coordinates


