

B2B Software Technologies Ltd is Rated Sell
2026-06-18 10:11:09B2B Software Technologies Ltd is rated 'Sell' by MarketsMOJO, with this rating last updated on 11 April 2026. However, the analysis and financial metrics discussed below reflect the stock's current position as of 18 June 2026, providing investors with an up-to-date view of the company’s fundamentals, returns, and technical outlook.
Read full news article
B2B Software Technologies Ltd is Rated Sell
2026-06-05 10:10:38B2B Software Technologies Ltd is rated 'Sell' by MarketsMOJO, with this rating last updated on 11 April 2026. However, the analysis and financial metrics discussed below reflect the stock's current position as of 08 June 2026, providing investors with an up-to-date view of the company's fundamentals, returns, and technical outlook.
Read full news article
B2B Software Technologies Ltd is Rated Sell
2026-05-20 10:10:37B2B Software Technologies Ltd is rated 'Sell' by MarketsMOJO, with this rating last updated on 11 Apr 2026. However, the analysis and financial metrics discussed here reflect the stock's current position as of 20 May 2026, providing investors with an up-to-date view of its fundamentals, returns, and technical outlook.
Read full news article
B2B Software Technologies Ltd is Rated Sell
2026-05-07 10:10:59B2B Software Technologies Ltd is rated 'Sell' by MarketsMOJO, with this rating last updated on 11 Apr 2026. However, the analysis and financial metrics discussed here reflect the stock's current position as of 07 May 2026, providing investors with the latest insights into the company’s performance and outlook.
Read full news article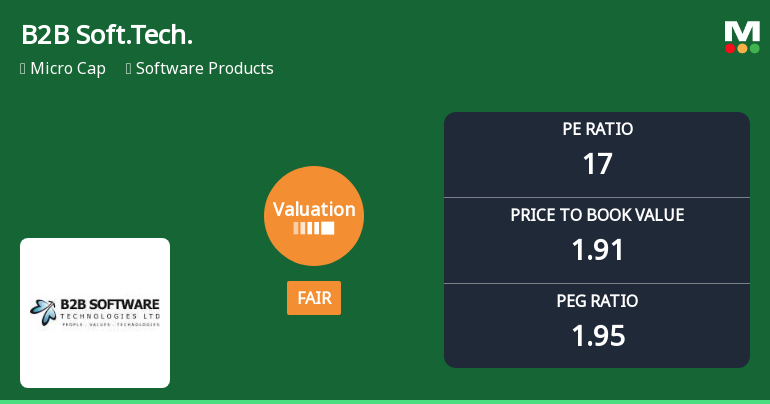
B2B Software Technologies Ltd Valuation Shifts Signal Renewed Price Attractiveness
2026-05-04 08:00:55B2B Software Technologies Ltd has witnessed a notable shift in its valuation parameters, moving from an expensive to a fair valuation grade as of early 2026. This change reflects evolving market perceptions amid mixed financial metrics and a volatile sector backdrop, prompting a reassessment of the stock’s price attractiveness relative to its historical averages and peer group.
Read full news article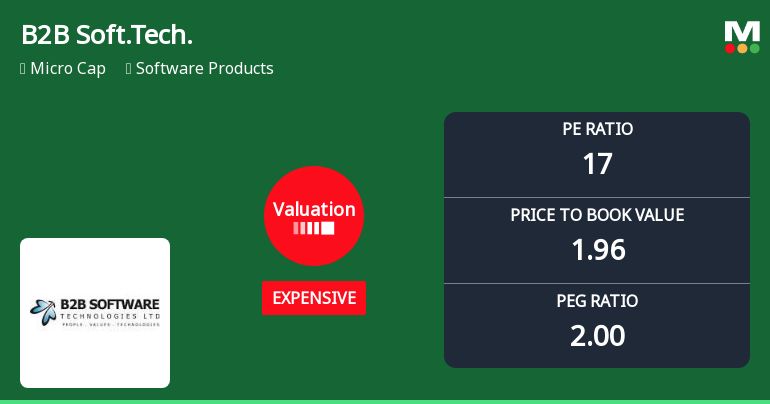
B2B Software Technologies Ltd Valuation Shifts Signal Price Attractiveness Concerns
2026-04-27 08:00:32B2B Software Technologies Ltd has seen a notable shift in its valuation parameters, moving from fair to expensive territory, raising questions about its price attractiveness relative to historical levels and peer benchmarks. Despite strong returns over multiple timeframes, the company’s elevated price-to-earnings and price-to-book ratios suggest investors should carefully reassess its current market positioning.
Read full news article
B2B Software Technologies Ltd is Rated Sell
2026-04-23 10:10:41B2B Software Technologies Ltd is rated 'Sell' by MarketsMOJO, with this rating last updated on 11 April 2026. However, the analysis and financial metrics discussed here reflect the stock's current position as of 23 April 2026, providing investors with an up-to-date perspective on the company’s fundamentals, valuation, financial trend, and technical outlook.
Read full news article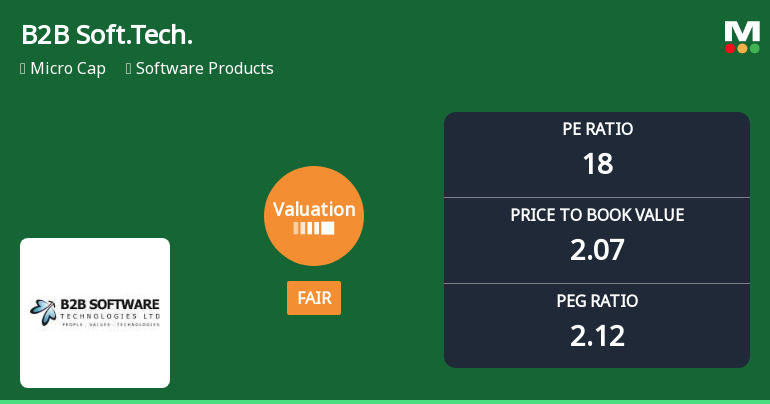
B2B Software Technologies Ltd: Valuation Shifts Signal Renewed Price Attractiveness
2026-04-21 08:00:45B2B Software Technologies Ltd has undergone a notable shift in its valuation parameters, moving from a very expensive rating to a fair valuation grade. This change reflects evolving market perceptions amid mixed financial metrics and a volatile price performance relative to benchmarks such as the Sensex and peer companies in the software products sector.
Read full news article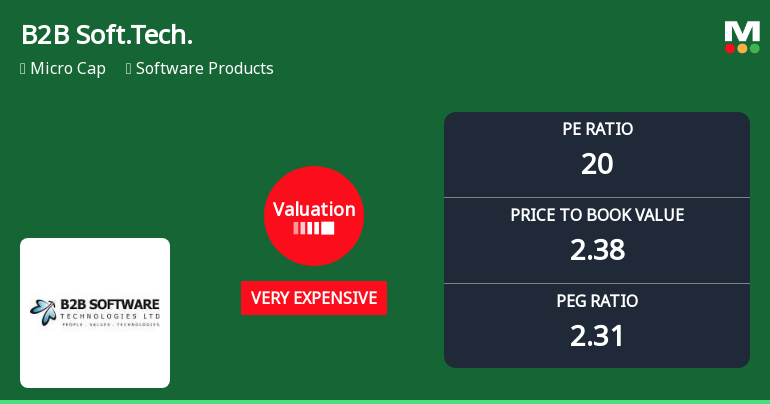
B2B Software Technologies Ltd Valuation Shifts Amidst Strong Returns
2026-04-15 08:01:16B2B Software Technologies Ltd has experienced a notable shift in its valuation parameters, moving from an expensive to a very expensive rating, despite delivering exceptional returns over recent years. This micro-cap software products company’s price-to-earnings (P/E) and price-to-book value (P/BV) ratios have risen, prompting a downgrade in its Mojo Grade from Hold to Sell as of 10 February 2026. Investors are now reassessing the stock’s price attractiveness in light of these changes and its performance relative to peers and the broader market.
Read full news articleAnnouncement under Regulation 30 (LODR)-Award_of_Order_Receipt_of_Order
02-Jun-2026 | Source : BSEReceipt of order
Compliances-Reg.24(A)-Annual Secretarial Compliance
30-May-2026 | Source : BSEAnnual Secretarial Compliance Report for the FY ended 31.03.2026
Format of the Initial Disclosure to be made by an entity identified as a Large Corporate : Annexure A
27-Apr-2026 | Source : BSEFormat of Initial Disclosure to be made by an entity identified as a Large Corporate.
| Sr. No. | Particulars | Details |
| 1 | Name of Company | B2B Software Technologies Ltd |
| 2 | CIN NO. | L72200TG1994PLC018351 |
| 3 | Outstanding borrowing of company as on 31st March / 31st December as applicable (in Rs cr) | 0.00 |
| 4 | Highest Credit Rating during the previous FY | NA |
| 4a | Name of the Credit Rating Agency issuing the Credit Rating mentioned in (4) | Not Applicable |
| 5 | Name of Stock Exchange# in which the fine shall be paid in case of shortfall in the required borrowing under the framework | BSE |
Designation: Company Secretary and Compliance Officer
EmailId: csy@b2bsoftech.com
Designation: CFO
EmailId: cfo@b2bsoftech.com
Date: 27/04/2026
Note: In terms para of 3.2(ii) of the circular beginning F.Y 2022 in the event of shortfall in the mandatory borrowing through debt securities a fine of 0.2% of the shortfall shall be levied by Stock Exchanges at the end of the two-year block period. Therefore an entity identified as LC shall provide in its initial disclosure for a financial year the name of Stock Exchange to which it would pay the fine in case of shortfall in the mandatory borrowing through debt markets.
Corporate Actions

No Upcoming Board Meetings

B2B Software Technologies Ltd has declared 10% dividend, ex-date: 06 Feb 26

No Splits history available

B2B Software Technologies Ltd has announced 1:2 bonus issue, ex-date: 02 Apr 26

No Rights history available


