Permanent Magnet

  • Market Cap: Micro Cap
  • Industry: Other Electrical Equipment
  • ISIN: INE418E01018
  • NSEID:
  • BSEID: 504132
INR
913.95
23.35 (2.62%)
BSENSE

Jul 09, 11:06 AM

BSE+NSE Vol: 837

  • Price Points
  • Score
  • Mojo Parameters
  • Total Return
  • News and Corporate Actions
  • Key factors
  • Shareholding
  • Financials
  • CompanyCV
stock-summaryPrice Point
High/Low

1Day

52 Week

Valuation
Technical
Day's Volume

CASH

837 (32.39%) Volume

Shareholding (Mar 2026)

FII

0.00%

Held by 0 FIIs

DII

0.01%

Held by 0 DIIs

Promoter

58.01%

Why is Permanent Magnets Ltd falling/rising?

08-Jul-2026

As of 08-Jul, the stock price of Permanent Magnets Ltd is currently at 890.60, reflecting a decline of 4.54% and a total drop of 7.46% over the last three days. The stock has underperformed its sector and shows a bearish trend, with significant drops in trading activity and a 40.57% decrease over the last three years.

As of 08-Jul, the stock price of Permanent Magnets Ltd is falling, currently at 890.60, which reflects a decrease of 42.4 points or 4.54%. This decline is part of a broader trend, as the stock has been losing value for the last three days, accumulating a total drop of 7.46% during this period. Additionally, the stock has underperformed its sector by 2.34% today, indicating a weaker performance relative to its peers.<BR><BR>The stock's recent performance shows a 1-week decline of 6.22%, while over the past month, it has managed a gain of 8.84%. However, the year-to-date performance is modest at 2.60%, and the stock has experienced a significant drop of 40.57% over the last three years. The trading activity also suggests a lack of investor interest, with delivery volume falling by 74.96% compared to the 5-day average, which may contribute to the downward pressure on the stock price.<BR><BR>Furthermore, the stock's price movement is below the 5-day, 20-day, and 50-day moving averages, indicating a bearish trend in the short term, even though it remains above the 100-day and 200-day moving averages. The overall action in the engineering sector, which has fallen by 2.25%, may also be influencing the stock's performance negatively.

View full answer

Should I buy, sell or hold Permanent Magnets Ltd?

23-Jun-2026

How big is Permanent Magnet?

11-Jun-2026

As of 10th June, Permanent Magnets Ltd has a market capitalization of 708.00 Cr, with recent net sales of 226.24 Cr and a net profit of 14.78 Cr. Shareholder's funds are 144.04 Cr, and total assets amount to 191.34 Cr as of March 2025.

As of 10th June, Permanent Magnets Ltd has a market capitalization of 708.00 Cr, classified as a Micro Cap.<BR><BR>In the latest four quarters, the company reported Net Sales of 226.24 Cr and a Net Profit of 14.78 Cr.<BR><BR>The latest annual period for the balance sheet is March 2025, with Shareholder's Funds amounting to 144.04 Cr and Total Assets of 191.34 Cr.

View full answer

Who are in the management team of Permanent Magnet?

11-Jun-2026

The management team of Permanent Magnet includes Rajeev Mundra (Chairman & Independent Director), Sharad Kumar Taparia (Managing Director), Kamal Shankarlal Binani (Independent Non-Executive Director), Mukul J Taparia (Non-Executive Director), Sunaina Taparia (Non-Executive Director), and Girish Desai (Non-Executive & Independent Director).

The management team of Permanent Magnet includes the following individuals:<BR><BR>1. **Rajeev Mundra** - Chairman & Independent Director<BR>2. **Sharad Kumar Taparia** - Managing Director<BR>3. **Kamal Shankarlal Binani** - Independent Non-Executive Director<BR>4. **Mukul J Taparia** - Non-Executive Director<BR>5. **Sunaina Taparia** - Non-Executive Director<BR>6. **Girish Desai** - Non-Executive & Independent Director<BR><BR>If you need more information about any specific member or their roles, feel free to ask!

View full answer

Who are the peers of the Permanent Magnet?

11-Jun-2026

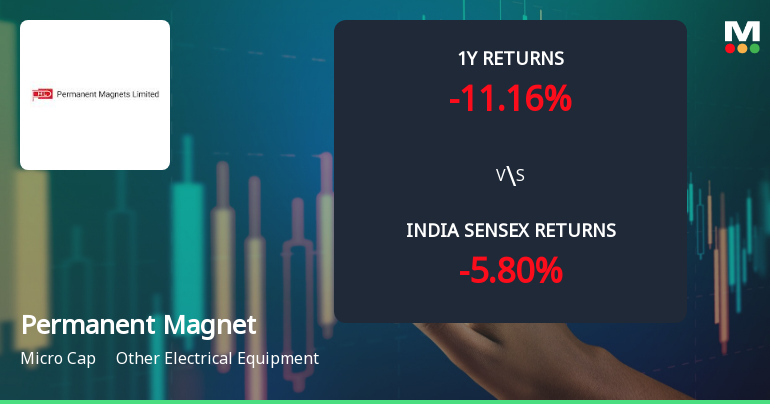
Peers of Permanent Magnet include Mangal Electrica, Prostarm Info, Spel Semiconduct, Kirl. Electric, Viviana Power, Supreme Power, Prizor Viztech, and Focus Lighting. Permanent Magnet has a 1-year return of -10.61%, with peers showing a range from -30.40% to 19.18%.

Peers: The peers of Permanent Magnet are Mangal Electrica, Prostarm Info, Spel Semiconduct, Kirl. Electric, Viviana Power, Supreme Power, Prizor Viztech, and Focus Lighting.<BR><BR>Quality Snapshot: Excellent management risk is observed at Viviana Power and Supreme Power, while Average management risk is found at Mangal Electrica, Prostarm Info, Permanent Magnet, and Prizor Viztech. Below Average management risk is noted at Spel Semiconduct and Kirl. Electric. Growth is Excellent at Viviana Power and Supreme Power, while Average growth is seen at Kirl. Electric and Below Average growth is present at Mangal Electrica, Prostarm Info, Permanent Magnet, and Spel Semiconduct. Good capital structure is noted at Mangal Electrica, Prostarm Info, Viviana Power, Supreme Power, and Prizor Viztech, while Below Average capital structure is found at Spel Semiconduct and Kirl. Electric, and Excellent capital structure is observed at Focus Lighting.<BR><BR>Return Snapshot: The peer with the highest 1-year return is Prostarm Info at 19.18%, while Kirl. Electric has the lowest at -30.40%. Permanent Magnet's 1-year return is -10.61%, which is higher than Kirl. Electric's but lower than Prostarm Info's. Additionally, the six-month return is negative for Mangal Electrica, Prostarm Info, Spel Semiconduct, Kirl. Electric, and Permanent Magnet.

View full answer

What does Permanent Magnet do?

10-Jun-2026

Permanent Magnets Ltd is a Micro Cap manufacturer of cast alloy permanent magnets for electric vehicles, with a market cap of INR 708 Cr, net sales of 67 Cr, and a net profit of 4 Cr as of March 2026. The company, part of the Taparia Group, has a P/E ratio of 45.00 and a dividend yield of 0.25%.

Overview: <BR>Permanent Magnets Ltd is a leading manufacturer of cast alloy permanent magnets and parts for electricity and electric vehicles, operating within the Other Electrical Equipment industry and classified as a Micro Cap company.<BR><BR>History: <BR>Incorporated in 1960, Permanent Magnets Ltd is a flagship company of the Taparia Group based in Mumbai. The latest quarterly results reported net sales and net profit for the period ending March 2026.<BR><BR>Financial Snapshot: <BR>Net Sales: 67 Cr (Quarterly Results - Mar 2026) <BR>Net Profit: 4 Cr (Quarterly Results - Mar 2026) <BR>Market Cap: INR 708 Cr (Micro Cap)<BR><BR>Key Metrics: <BR>P/E: 45.00 <BR>Industry P/E: 35 <BR>Dividend Yield: 0.25% <BR>Debt-Equity: 0.21 <BR>Return on Equity: 9.85% <BR>Price to Book: 4.44<BR><BR>Contact Details: <BR>Address: Harsh Avenue 302 3rd Floor, Silvassa Vapi Main Road Silvassa Dadra & Nagar Haveli (U T) : 396230 <BR>Tel: 022-28594060/6060 <BR>Email: bdshah@pmlindia.com <BR>Website: http://www.pmlindia.com

View full answer

Are Permanent Magnets Ltd latest results good or bad?

14-May-2026

Permanent Magnets Ltd's latest results are strong, with a 152.53% increase in net profit and a record quarterly revenue of ₹66.54 crore. However, concerns about margin volatility and a high valuation suggest investors should proceed with caution.

The latest results for Permanent Magnets Ltd indicate a strong performance overall. In the quarter ending March 2026, the company reported a net profit of ₹3.99 crore, which is a remarkable increase of 152.53% year-on-year. Additionally, net sales reached ₹66.54 crore, reflecting a significant year-on-year growth of 46.95%. This growth is particularly impressive as it marks the highest quarterly revenue in the company's history.<BR><BR>Despite these positive results, there are some concerns regarding margin volatility. The operating margin, while improved from the previous year, has shown fluctuations, which raises questions about the sustainability of profitability. The stock is currently trading at a high valuation of 60 times trailing earnings, nearly double the industry average, which could limit its upside potential.<BR><BR>Overall, while the recent results are good in terms of growth and profitability recovery, the high valuation and margin pressures suggest that investors should approach with caution. The strong performance in the short term is encouraging, but the long-term outlook may require careful monitoring of operational efficiencies and market conditions.

View full answer

Is Permanent Magnet technically bullish or bearish?

29-Nov-2025

As of November 28, 2025, the technical trend for Permanent Magnet is neutral with mixed signals, showing a shift from mildly bearish to sideways, as weekly indicators are bearish while monthly indicators are bullish, reflecting overall uncertainty.

As of 28 November 2025, the technical trend for Permanent Magnet has changed from mildly bearish to sideways. The current stance is neutral, with mixed signals across different time frames. The weekly MACD is bearish, while the monthly MACD is bullish, indicating conflicting momentum. The Bollinger Bands show a mildly bearish trend on the weekly chart and bearish on the monthly, suggesting potential downside pressure. Moving averages on the daily chart are mildly bullish, providing some support. The KST is bearish on the weekly and mildly bullish on the monthly, further contributing to the mixed outlook. Overall, the indicators reflect uncertainty, with no strong bullish or bearish signals prevailing at this time.

View full answer

How has been the historical performance of Permanent Magnet?

28-Nov-2025

Permanent Magnet's historical performance from March 2024 to March 2025 showed increased net sales and operating income, but a decline in profitability metrics, with profit after tax falling to 15.75 Cr and a decrease in profit margins. Shareholder's funds grew, while cash flow from operating activities improved, indicating mixed financial health.

Answer:<BR>The historical performance of Permanent Magnet shows a mixed trend in its financial metrics from March 2024 to March 2025.<BR><BR>Breakdown:<BR>In the fiscal year ending March 2025, Permanent Magnet reported net sales of 205.05 Cr, a slight increase from 201.48 Cr in the previous year. Total operating income also rose to 205.05 Cr from 201.48 Cr, while total expenditure increased to 174.61 Cr from 167.13 Cr. The operating profit (PBDIT) decreased to 34.60 Cr from 38.80 Cr, reflecting a decline in the operating profit margin from 17.05% to 14.85%. Profit before tax fell to 20.77 Cr from 28.26 Cr, leading to a profit after tax of 15.75 Cr, down from 20.20 Cr, resulting in a PAT margin decrease from 10.03% to 7.68%. On the balance sheet, shareholder's funds grew to 144.04 Cr from 129.85 Cr, and total liabilities slightly increased to 191.34 Cr from 189.10 Cr. The cash flow from operating activities improved to 38.00 Cr from 22.00 Cr, while the net cash inflow/outflow was neutral at 0.00 Cr compared to an inflow of 3.00 Cr the previous year. Overall, while sales and operating income showed growth, profitability metrics and cash flow from financing activities reflected challenges.

View full answer

Is Permanent Magnet overvalued or undervalued?

14-Nov-2025

As of November 13, 2025, Permanent Magnet is considered very expensive with a PE ratio of 59.38 and a year-to-date return of -13.06%, indicating it is overvalued compared to its peers and the broader market.

As of 13 November 2025, the valuation grade for Permanent Magnet has moved from expensive to very expensive, indicating a significant shift in its market perception. The company appears to be overvalued based on its current financial metrics, with a PE ratio of 59.38, a Price to Book Value of 4.79, and an EV to EBITDA of 26.30. These ratios suggest that the stock is trading at a premium compared to its underlying earnings and book value.<BR><BR>In comparison to its peers, Permanent Magnet's valuation stands out as particularly high. For instance, Rail Vikas has a PE ratio of 57.69, while Tube Investments is at 93.82, reflecting a broader trend of elevated valuations in the sector. However, the PEG ratio for Permanent Magnet is notably at 0.00, which raises questions about its growth prospects relative to its price. Additionally, the company's recent stock performance has lagged behind the Sensex, with a year-to-date return of -13.06% compared to the Sensex's 8.11%, further reinforcing the notion that Permanent Magnet is overvalued in the current market environment.

View full answer

When is the next results date for Permanent Magnet?

04-Nov-2025

The next results date for Permanent Magnet is 12 November 2025.

The next results date for Permanent Magnet is scheduled for 12 November 2025.

View full answer

Who are the top shareholders of the Permanent Magnet?

06-Jun-2025

The top shareholders of Permanent Magnet include Mukul Taparia with 15.86%, Ramesh Taparia at 2.69%, and individual investors collectively holding 34.22%. There are no mutual funds or foreign institutional investors currently involved.

The top shareholders of Permanent Magnet include the promoters, who hold the majority of the shares. The promoter with the highest holding is Mukul Taparia, owning 15.86% of the company. The highest public shareholder is Ramesh Taparia, with a holding of 2.69%. Additionally, individual investors collectively hold 34.22% of the shares. There are currently no mutual funds or foreign institutional investors (FIIs) holding shares in the company.

View full answer

Has Permanent Magnet declared dividend?

06-Jun-2025

Yes, Permanent Magnets Ltd has declared an 18% dividend, amounting to 1.8 per share, with an ex-date of August 1, 2024. While recent total returns have fluctuated, the company has shown significant long-term growth, especially over the past 3 to 5 years.

Permanent Magnets Ltd has declared an 18% dividend.<BR><BR>Dividend Details:<BR>- Percentage announced: 18%<BR>- Amount per share: 1.8<BR>- Ex-date: 01 Aug 24<BR><BR>Dividend Yield: 0.23%.<BR><BR>Total Returns by Period:<BR>In the last 6 months, the price return was 1.52%, with no dividend return, resulting in a total return of 1.52%.<BR><BR>Over the past year, the price return was -13.98%, with a dividend return of 0.17%, leading to a total return of -13.81%.<BR><BR>In the 2-year period, the price return was -10.86%, the dividend return was 0.28%, and the total return was -10.58%.<BR><BR>For the 3-year period, the price return was an impressive 189.84%, with a dividend return of 1.42%, culminating in a total return of 191.26%.<BR><BR>In the last 4 years, the price return stood at 205.77%, the dividend return was 1.64%, resulting in a total return of 207.41%.<BR><BR>Finally, over the past 5 years, the price return was a remarkable 795.62%, with a dividend return of 5.28%, leading to a total return of 800.9%.<BR><BR>Overall, Permanent Magnets Ltd has declared a substantial dividend, and while recent total returns have varied, the long-term performance shows significant growth, particularly in the last 3 to 5 years.

View full answer
iScoreScore
Click here to find our call on this stock
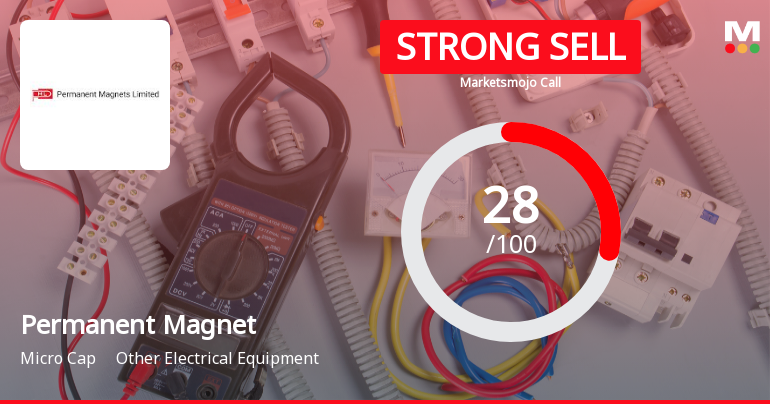
Strong Sell
Sell
Hold
Buy
Strong Buy

Dashboard

1

Strong ability to service debt as the company has a low Debt to EBITDA ratio of 0.96 times

 
2

Poor long term growth as Net Sales has grown by an annual rate of 14.08% and Operating profit at 3.72% over the last 5 years

 
3

Flat results in Mar 26

4

With ROCE of 11.6, it has a Very Expensive valuation with a 4.2 Enterprise value to Capital Employed

5

Despite the size of the company, domestic mutual funds hold only 0% of the company

6

Consistent Underperformance against the benchmark over the last 3 years

stock-summaryMojo Parameters

Mojo Parameters

Loading Valuation Snapshot...

Stock DNA

stock-summary
Industry

Other Electrical Equipment

stock-summary
Market cap

INR 786 Cr (Micro Cap)

stock-summary
P/E

49.00

stock-summary
Industry P/E

35

stock-summary
Dividend Yield

0.22%

stock-summary
Debt Equity

0.21

stock-summary
Return on Equity

9.85%

stock-summary
Price to Book

4.86

Revenue and Profits:
Net Sales:
67 Cr
(Quarterly Results - Mar 2026)
Net Profit:
4 Cr
stock-summaryTotal Returns
Total Returns (Price + Dividend) stock-summary
Dividend Yield (0.22%)
TimePeriod
Price Return
Dividend Return
Total Return
3 Months
15.45%
0%
15.45%
6 Months
6.15%
0%
6.15%
1 Year
-2.72%
0.22%
-2.5%
2 Years
-13.86%
0.36%
-13.5%
3 Years
-39.02%
0.37%
-38.65%
4 Years
173.39%
1.97%
175.36%
5 Years
141.72%
1.74%
143.46%

Latest dividend: 2 per share ex-dividend date: Jul-30-2025

Risk Adjusted Returns v/s stock-summary
Returns Beta
Icon
Beta has not been calculated since enough price history is not available
stock-summaryNews & Corporate Actions

News

Permanent Magnets Ltd Gains 6.20%: 3 Key Factors Driving the Week’s Momentum

Announcements stock-summary

Quarterly Disclosures By Listed Entities Of Defaults On Payment Of Interest/ Repayment Of Principal Amount On Loans From Banks / Financial Institutions And Unlisted Debt Securities

06-Jul-2026 | Source : BSE

Quarterly Disclosures by listed entities of defaults on payment of interest/ repayment of principal amount on loans from banks / financial institutions and unlisted debt securities

Compliances-Certificate under Reg. 74 (5) of SEBI (DP) Regulations 2018

06-Jul-2026 | Source : BSE

Certificate under Reg. 74 (5) of SEBI (DP) Regulations 2018

Closure of Trading Window

26-Jun-2026 | Source : BSE

Intimation of Closure of Trading window for the quarter ended June 30 2026

Corporate Actions stock-summary

stock-summary
BOARD MEETING

No Upcoming Board Meetings

stock-summary
DIVIDEND

Permanent Magnets Ltd has declared 20% dividend, ex-date: 30 Jul 25

stock-summary
SPLITS

No Splits history available

stock-summary
BONUS

No Bonus history available

stock-summary
RIGHTS

No Rights history available

stock-summaryKey Factors

Quality key factors stock-summary

Factor
Value
Sales Growth (5y)
14.08%
EBIT Growth (5y)
3.72%
EBIT to Interest (avg)
8.26
Debt to EBITDA (avg)
0.49
Net Debt to Equity (avg)
0.21
Sales to Capital Employed (avg)
1.37
Tax Ratio
33.99%
Dividend Payout Ratio
11.34%
Pledged Shares
0
Institutional Holding
0.01%
ROCE (avg)
25.86%
ROE (avg)
10.39%

Valuation key factors

Factor
Value
P/E Ratio
49
Industry P/E
35
Price to Book Value
4.86
EV to EBIT
36.02
EV to EBITDA
21.77
EV to Capital Employed
4.19
EV to Sales
3.53
PEG Ratio
1.21
Dividend Yield
0.22%
ROCE (Latest)
11.63%
ROE (Latest)
9.85%

Technicals key factors

Indicator
Weekly
Monthly
MACD
Bullish
Mildly Bullish
RSI
No Signal
No Signal
Bollinger Bands
Mildly Bullish
Mildly Bullish
Moving Averages
Mildly Bullish (Daily)
KST
Bullish
Mildly Bullish
Dow Theory
Mildly Bullish
No Trend
stock-summary Technical Indicator Scale: Bearish, Mildly Bearish, Sideways, Mildly Bullish, Bullish  Turned 
stock-summaryShareholding
Shareholding Snapshot : Mar 2026stock-summary
Shareholding Compare (%holding) stock-summary
Majority shareholders

Promoters

Pledged Promoter Holdings

None

Mutual Funds

Held by 0 Schemes

FIIs

Held by 0 FIIs

Promoter with highest holding

Mukul Taparia (16.3%)

Highest Public shareholder

Ramesh Taparia (2.46%)

Individual Investors Holdings

35.22%

stock-summaryFinancial
[
  {
    "link": "quarterly",
    "btn_text": "All Quarterly Results",
    "header": "Quarterly Results Snapshot (Consolidated) - Mar'26 - YoY",
    "rhs": [
      {
        "prefix": "Net Sales ",
        "suffix": "YoY Growth in quarter ended Mar 2026 is 46.95% vs -15.52% in Mar 2025",
        "dir": 1
      },
      {
        "prefix": "Consolidated Net Profit ",
        "suffix": "YoY Growth in quarter ended Mar 2026 is 152.53% vs -37.05% in Mar 2025",
        "dir": 1
      }
    ],
    "table": {
      "header": [
        "Mar'26",
        "Mar'25",
        "Change(%)"
      ],
      "body": [
        {
          "field": "Net Sales",
          "val1": "66.54",
          "val2": "45.28",
          "chgp": "46.95%",
          "chgp_class": "positive"
        },
        {
          "field": "Operating Profit (PBDIT) excl Other Income",
          "val1": "9.49",
          "val2": "5.05",
          "chgp": "87.92%",
          "chgp_class": "positive"
        },
        {
          "field": "Interest",
          "val1": "1.56",
          "val2": "0.28",
          "chgp": "457.14%",
          "chgp_class": "negative"
        },
        {
          "field": "Exceptional Items",
          "val1": "0.48",
          "val2": "0.00",
          "chgp": "",
          "chgp_class": "neutral"
        },
        {
          "field": "Consolidate Net Profit",
          "val1": "3.99",
          "val2": "1.58",
          "chgp": "152.53%",
          "chgp_class": "positive"
        },
        {
          "field": "Operating Profit Margin (Excl OI)",
          "val1": "14.26%",
          "val2": "11.15%",
          "chgp": "3.11%",
          "chgp_class": "positive"
        }
      ]
    }
  },
  {
    "link": "half-yearly",
    "btn_text": "All Half Yearly Results",
    "header": "Half Yearly Results Snapshot (Consolidated) - Sep'25",
    "rhs": [
      {
        "prefix": "Net Sales ",
        "suffix": " Growth in half year ended Sep 2025 is -7.01% vs 13.43% in Sep 2024",
        "dir": -1
      },
      {
        "prefix": "Consolidated Net Profit ",
        "suffix": " Growth in half year ended Sep 2025 is -29.68% vs -12.48% in Sep 2024",
        "dir": -1
      }
    ],
    "table": {
      "header": [
        "Sep'25",
        "Sep'24",
        "Change(%)"
      ],
      "body": [
        {
          "field": "Net Sales",
          "val1": "102.68",
          "val2": "110.42",
          "chgp": "-7.01%",
          "chgp_class": "negative"
        },
        {
          "field": "Operating Profit (PBDIT) excl Other Income",
          "val1": "16.69",
          "val2": "19.12",
          "chgp": "-12.71%",
          "chgp_class": "negative"
        },
        {
          "field": "Interest",
          "val1": "1.09",
          "val2": "1.09",
          "chgp": "",
          "chgp_class": "neutral"
        },
        {
          "field": "Exceptional Items",
          "val1": "0.00",
          "val2": "0.00",
          "chgp": "",
          "chgp_class": "neutral"
        },
        {
          "field": "Consolidate Net Profit",
          "val1": "8.53",
          "val2": "12.13",
          "chgp": "-29.68%",
          "chgp_class": "negative"
        },
        {
          "field": "Operating Profit Margin (Excl OI)",
          "val1": "16.25%",
          "val2": "17.32%",
          "chgp": "-1.07%",
          "chgp_class": "negative"
        }
      ]
    }
  },
  {
    "link": "nine-monthly",
    "btn_text": "All Nine Monthly Results",
    "header": "Nine Monthly Results Snapshot (Consolidated) - Dec'25",
    "rhs": [
      {
        "prefix": "Net Sales ",
        "suffix": "YoY Growth in nine months ended Dec 2025 is -0.04% vs 8.04% in Dec 2024",
        "dir": -1
      },
      {
        "prefix": "Consolidated Net Profit ",
        "suffix": "YoY Growth in nine months ended Dec 2025 is -23.92% vs -19.94% in Dec 2024",
        "dir": -1
      }
    ],
    "table": {
      "header": [
        "Dec'25",
        "Dec'24",
        "Change(%)"
      ],
      "body": [
        {
          "field": "Net Sales",
          "val1": "159.70",
          "val2": "159.77",
          "chgp": "-0.04%",
          "chgp_class": "negative"
        },
        {
          "field": "Operating Profit (PBDIT) excl Other Income",
          "val1": "27.20",
          "val2": "25.41",
          "chgp": "7.04%",
          "chgp_class": "positive"
        },
        {
          "field": "Interest",
          "val1": "2.54",
          "val2": "2.12",
          "chgp": "19.81%",
          "chgp_class": "negative"
        },
        {
          "field": "Exceptional Items",
          "val1": "-2.23",
          "val2": "0.00",
          "chgp": "",
          "chgp_class": "neutral"
        },
        {
          "field": "Consolidate Net Profit",
          "val1": "10.78",
          "val2": "14.17",
          "chgp": "-23.92%",
          "chgp_class": "negative"
        },
        {
          "field": "Operating Profit Margin (Excl OI)",
          "val1": "17.03%",
          "val2": "15.90%",
          "chgp": "1.13%",
          "chgp_class": "positive"
        }
      ]
    }
  },
  {
    "link": "annual",
    "btn_text": "All Annual Results",
    "header": "Annual Results Snapshot (Consolidated) - Mar'26",
    "rhs": [
      {
        "prefix": "Net Sales ",
        "suffix": "YoY Growth in year ended Mar 2026 is 10.33% vs 1.77% in Mar 2025",
        "dir": 1
      },
      {
        "prefix": "Consolidated Net Profit ",
        "suffix": "YoY Growth in year ended Mar 2026 is -6.22% vs -22.03% in Mar 2025",
        "dir": 1
      }
    ],
    "table": {
      "header": [
        "Mar'26",
        "Mar'25",
        "Change(%)"
      ],
      "body": [
        {
          "field": "Net Sales",
          "val1": "226.24",
          "val2": "205.05",
          "chgp": "10.33%",
          "chgp_class": "positive"
        },
        {
          "field": "Operating Profit (PBDIT) excl Other Income",
          "val1": "36.69",
          "val2": "30.44",
          "chgp": "20.53%",
          "chgp_class": "positive"
        },
        {
          "field": "Interest",
          "val1": "4.10",
          "val2": "2.40",
          "chgp": "70.83%",
          "chgp_class": "negative"
        },
        {
          "field": "Exceptional Items",
          "val1": "-1.75",
          "val2": "0.00",
          "chgp": "",
          "chgp_class": "neutral"
        },
        {
          "field": "Consolidate Net Profit",
          "val1": "14.77",
          "val2": "15.75",
          "chgp": "-6.22%",
          "chgp_class": "negative"
        },
        {
          "field": "Operating Profit Margin (Excl OI)",
          "val1": "16.22%",
          "val2": "14.85%",
          "chgp": "1.37%",
          "chgp_class": "positive"
        }
      ]
    }
  }
]

Quarterly Results Snapshot (Consolidated) - Mar'26 - YoYstock-summary

Mar'26
Mar'25
Change(%)
Net Sales
66.54
45.28
46.95%
Operating Profit (PBDIT) excl Other Income
9.49
5.05
87.92%
Interest
1.56
0.28
457.14%
Exceptional Items
0.48
0.00
Consolidate Net Profit
3.99
1.58
152.53%
Operating Profit Margin (Excl OI)
14.26%
11.15%
3.11%
Values in Rs Cr.
Direction Arrows
Net Sales

YoY Growth in quarter ended Mar 2026 is 46.95% vs -15.52% in Mar 2025

Direction Arrows
Consolidated Net Profit

YoY Growth in quarter ended Mar 2026 is 152.53% vs -37.05% in Mar 2025

Half Yearly Results Snapshot (Consolidated) - Sep'25stock-summary

Sep'25
Sep'24
Change(%)
Net Sales
102.68
110.42
-7.01%
Operating Profit (PBDIT) excl Other Income
16.69
19.12
-12.71%
Interest
1.09
1.09
Exceptional Items
0.00
0.00
Consolidate Net Profit
8.53
12.13
-29.68%
Operating Profit Margin (Excl OI)
16.25%
17.32%
-1.07%
Values in Rs Cr.
Direction Arrows
Net Sales

Growth in half year ended Sep 2025 is -7.01% vs 13.43% in Sep 2024

Direction Arrows
Consolidated Net Profit

Growth in half year ended Sep 2025 is -29.68% vs -12.48% in Sep 2024

Nine Monthly Results Snapshot (Consolidated) - Dec'25stock-summary

Dec'25
Dec'24
Change(%)
Net Sales
159.70
159.77
-0.04%
Operating Profit (PBDIT) excl Other Income
27.20
25.41
7.04%
Interest
2.54
2.12
19.81%
Exceptional Items
-2.23
0.00
Consolidate Net Profit
10.78
14.17
-23.92%
Operating Profit Margin (Excl OI)
17.03%
15.90%
1.13%
Values in Rs Cr.
Direction Arrows
Net Sales

YoY Growth in nine months ended Dec 2025 is -0.04% vs 8.04% in Dec 2024

Direction Arrows
Consolidated Net Profit

YoY Growth in nine months ended Dec 2025 is -23.92% vs -19.94% in Dec 2024

Annual Results Snapshot (Consolidated) - Mar'26stock-summary

Mar'26
Mar'25
Change(%)
Net Sales
226.24
205.05
10.33%
Operating Profit (PBDIT) excl Other Income
36.69
30.44
20.53%
Interest
4.10
2.40
70.83%
Exceptional Items
-1.75
0.00
Consolidate Net Profit
14.77
15.75
-6.22%
Operating Profit Margin (Excl OI)
16.22%
14.85%
1.37%
Values in Rs Cr.
Direction Arrows
Net Sales

YoY Growth in year ended Mar 2026 is 10.33% vs 1.77% in Mar 2025

Direction Arrows
Consolidated Net Profit

YoY Growth in year ended Mar 2026 is -6.22% vs -22.03% in Mar 2025

stock-summaryCompany CV
About Permanent Magnets Ltd stock-summary
stock-summary
Permanent Magnets Ltd
Micro Cap
Other Electrical Equipment
Incorporated in 1960, Permanent Magnet Limited is one of the flagship Companies of Taparia Group, Mumbai and one of the leading manufacturers of Cast alloy Permanent Magnets, Parts and accessories of electricity and electric vehicle parts in the world.
Company Coordinates stock-summary
Company Details
Harsh Avenue 302 3rd Floor, Silvassa Vapi Main Road Silvassa Dadra & Nagar Haveli (U T) : 396230
stock-summary
Tel: 022-28594060/6060
stock-summary
bdshah@pmlindia.com
Registrar Details
Adroit Corporate Services Pvt Ltd, 17-20 Jaferbhoy Industrial Estate , 1st Floor, Makwana Road, Marol Naka, Mumbai