
Compare Permanent Magnet with Similar Stocks
Dashboard
Strong ability to service debt as the company has a low Debt to EBITDA ratio of 0.96 times
Poor long term growth as Net Sales has grown by an annual rate of 14.08% and Operating profit at 3.72% over the last 5 years
Flat results in Mar 26
With ROCE of 11.6, it has a Very Expensive valuation with a 4.5 Enterprise value to Capital Employed
Despite the size of the company, domestic mutual funds hold only 0% of the company
Stock DNA
Other Electrical Equipment
INR 804 Cr (Micro Cap)
53.00
38
0.21%
0.21
9.85%
5.09
Total Returns (Price + Dividend) 
Latest dividend: 2 per share ex-dividend date: Jul-30-2025
Risk Adjusted Returns v/s
Returns Beta

News

Permanent Magnets Ltd Upgraded to Hold as Technicals Improve Amidst Valuation Concerns
Permanent Magnets Ltd, a micro-cap player in the Other Electrical Equipment sector, has seen its investment rating upgraded from Sell to Hold, driven primarily by a marked improvement in technical indicators. Despite this positive shift, the company’s valuation has moved into the very expensive territory, reflecting a complex investment outlook amid flat recent financial performance and mixed long-term growth metrics.
Read full news article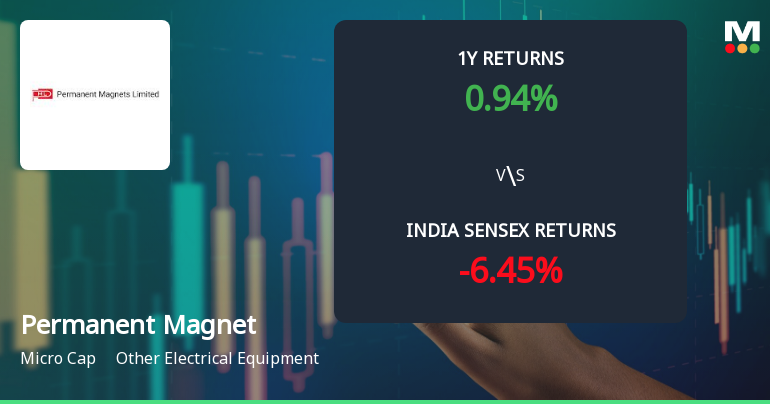
Permanent Magnets Ltd Sees Bullish Momentum Shift Amid Technical Upgrades
Permanent Magnets Ltd has experienced a notable shift in price momentum, transitioning from a mildly bearish to a bullish technical trend. This change is underscored by a series of positive signals across key technical indicators, including MACD, Bollinger Bands, and moving averages, suggesting renewed investor confidence in this micro-cap player within the Other Electrical Equipment sector.
Read full news article
Golden Cross Forms in Permanent Magnets Ltd Amid Mixed Technical Signals
The 50-day moving average has crossed above the 200-day for Permanent Magnets Ltd, signalling a golden cross on 22 Jun 2026. Yet, the monthly technical indicators remain bearish, and the stock’s recent price action suggests a nuanced picture rather than a straightforward bullish signal.
Read full news article Announcements
Announcement under Regulation 30 (LODR)-Analyst / Investor Meet - Intimation
18-Jun-2026 | Source : BSEIntimation of Schedule of Analyst/ Investor Meeting under Regulation 30 of SEBI (Listing Obligations and Disclosure Requirements) Regulations 2015.
Announcement under Regulation 30 (LODR)-Analyst / Investor Meet - Outcome
21-May-2026 | Source : BSETranscript of Conference Call with reference to the Audited Financial Results for the quarter and year ended March 31 2026
Announcement under Regulation 30 (LODR)-Analyst / Investor Meet - Intimation
19-May-2026 | Source : BSEIntimation of Schedule of Analyst/ Investor Meeting under Regulation 30 of SEBI (Listing Obligations and Disclosure Requirements) Regulations 2015
Corporate Actions

No Upcoming Board Meetings

Permanent Magnets Ltd has declared 20% dividend, ex-date: 30 Jul 25

No Splits history available

No Bonus history available

No Rights history available
Quality key factors
Valuation key factors
Technicals key factors
 Technical Indicator Scale: Bearish, Mildly Bearish, Sideways, Mildly Bullish, Bullish Turned
 Shareholding Snapshot : Mar 2026
Shareholding Compare (%holding)
Promoters
None
Held by 0 Schemes
Held by 0 FIIs
Mukul Taparia (16.3%)
Ramesh Taparia (2.46%)
35.22%
Quarterly Results Snapshot (Consolidated) - Mar'26 - YoY

YoY Growth in quarter ended Mar 2026 is 46.95% vs -15.52% in Mar 2025
YoY Growth in quarter ended Mar 2026 is 152.53% vs -37.05% in Mar 2025
Half Yearly Results Snapshot (Consolidated) - Sep'25

Growth in half year ended Sep 2025 is -7.01% vs 13.43% in Sep 2024
Growth in half year ended Sep 2025 is -29.68% vs -12.48% in Sep 2024
Nine Monthly Results Snapshot (Consolidated) - Dec'25
YoY Growth in nine months ended Dec 2025 is -0.04% vs 8.04% in Dec 2024
YoY Growth in nine months ended Dec 2025 is -23.92% vs -19.94% in Dec 2024
Annual Results Snapshot (Consolidated) - Mar'26
YoY Growth in year ended Mar 2026 is 10.33% vs 1.77% in Mar 2025
YoY Growth in year ended Mar 2026 is -6.22% vs -22.03% in Mar 2025
About Permanent Magnets Ltd

Company Coordinates


