
Compare Guj Pipavav Port with Similar Stocks
Stock DNA
Transport Infrastructure
INR 7,358 Cr (Small Cap)
15.00
15
6.35%
-0.27
20.95%
3.06
Total Returns (Price + Dividend) 
Latest dividend: 5.4 per share ex-dividend date: Nov-12-2025
Risk Adjusted Returns v/s
Returns Beta

News
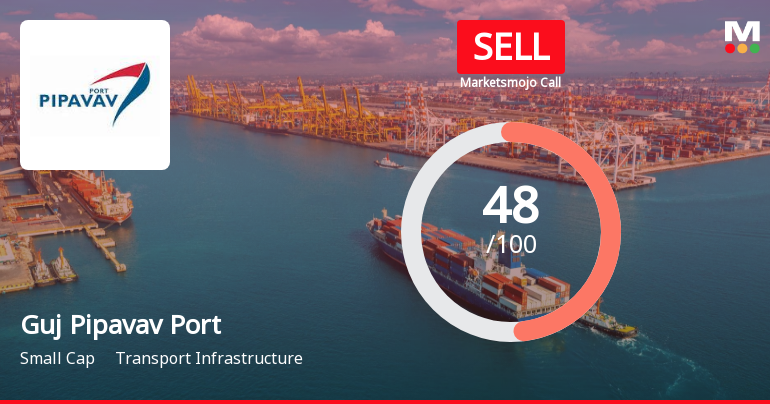
Gujarat Pipavav Port Ltd is Rated Sell
Gujarat Pipavav Port Ltd is rated Sell by MarketsMOJO, with this rating last updated on 23 March 2026. However, the analysis and financial metrics presented here reflect the stock’s current position as of 01 July 2026, providing investors with an up-to-date view of the company’s fundamentals, returns, and market standing.
Read full news article
Gujarat Pipavav Port Ltd is Rated Sell
Gujarat Pipavav Port Ltd is rated Sell by MarketsMOJO, with this rating last updated on 23 March 2026. However, the analysis and financial metrics discussed here reflect the stock’s current position as of 20 June 2026, providing investors with an up-to-date view of its fundamentals, returns, and market standing.
Read full news article
Gujarat Pipavav Port Ltd is Rated Sell
Gujarat Pipavav Port Ltd is rated 'Sell' by MarketsMOJO, with this rating last updated on 23 March 2026. However, the analysis and financial metrics discussed here reflect the stock's current position as of 09 June 2026, providing investors with an up-to-date view of the company’s fundamentals, valuation, financial trends, and technical outlook.
Read full news article Announcements
Closure of Trading Window
26-Jun-2026 | Source : BSEIntimation regarding Closure of Trading Window attached
Announcement under Regulation 30 (LODR)-Analyst / Investor Meet - Intimation
28-May-2026 | Source : BSEPresentation to be made at the Webinar on 29th May 2026 attached
Intimation Regarding Record Date
28-May-2026 | Source : BSEIntimation regarding Record Date to determine Members eligible for Final Dividend attached
Corporate Actions

No Upcoming Board Meetings

Gujarat Pipavav Port Ltd has declared 54% dividend, ex-date: 12 Nov 25

No Splits history available

No Bonus history available

No Rights history available
Quality key factors
Valuation key factors
Technicals key factors
 Technical Indicator Scale: Bearish, Mildly Bearish, Sideways, Mildly Bullish, Bullish Turned
 Shareholding Snapshot : Mar 2026
Shareholding Compare (%holding)
Promoters
None
Held by 9 Schemes (14.53%)
Held by 210 FIIs (22.14%)
Apm Terminals Mauritius Limited (44.01%)
Hdfc Trustee Company Ltd. A/c Hdfc Balanced Advant (7.3%)
13.81%
Quarterly Results Snapshot (Consolidated) - Mar'26 - QoQ

QoQ Growth in quarter ended Mar 2026 is 8.67% vs -2.49% in Dec 2025
QoQ Growth in quarter ended Mar 2026 is 31.78% vs -32.86% in Dec 2025
Half Yearly Results Snapshot (Consolidated) - Sep'25
Growth in half year ended Sep 2025 is 16.23% vs 1.18% in Sep 2024
Growth in half year ended Sep 2025 is 43.15% vs 15.65% in Sep 2024
Nine Monthly Results Snapshot (Consolidated) - Dec'25
YoY Growth in nine months ended Dec 2025 is 14.37% vs -0.17% in Dec 2024
YoY Growth in nine months ended Dec 2025 is 31.08% vs 3.03% in Dec 2024
Annual Results Snapshot (Consolidated) - Mar'26
YoY Growth in year ended Mar 2026 is 17.48% vs -0.24% in Mar 2025
YoY Growth in year ended Mar 2026 is 29.80% vs 16.05% in Mar 2025
About Gujarat Pipavav Port Ltd

Company Coordinates


