
Compare Hittco Tools with Similar Stocks
Dashboard
Weak Long Term Fundamental Strength with a -18.03% CAGR growth in Operating Profits over the last 5 years
- Low ability to service debt as the company has a high Debt to EBITDA ratio of 4.19 times
- The company has been able to generate a Return on Capital Employed (avg) of 6.34% signifying low profitability per unit of total capital (equity and debt)
Flat results in Mar 26
Risky - Negative Operating Profits
Underperformed the market in the last 1 year
Stock DNA
Industrial Manufacturing
INR 9 Cr (Micro Cap)
NA (Loss Making)
36
0.00%
1.06
-20.54%
2.66
Total Returns (Price + Dividend) 
Hittco Tools for the last several years.
Risk Adjusted Returns v/s
Returns Beta

News
Are Hittco Tools Ltd latest results good or bad?
Hittco Tools Ltd's latest financial results for the quarter ended March 2026 indicate a notable recovery from previous performance challenges. The company reported net sales of ₹2.47 crores, reflecting a quarter-on-quarter growth of 29.32% compared to ₹1.91 crores in the prior quarter. However, this figure represents a decline of 5.73% when compared year-on-year to ₹2.62 crores in the same quarter of the previous fiscal year. A significant highlight from the results is the recovery in operating margins, which reached 21.86%, a substantial improvement from the negative margin of -12.04% recorded in the previous quarter. This margin recovery was primarily driven by better revenue realization and improved cost absorption, as evidenced by a decrease in employee costs as a percentage of sales. The company achieved a net profit of ₹0.12 crores, a stark contrast to the losses reported in the preceding three quar...
Read full news article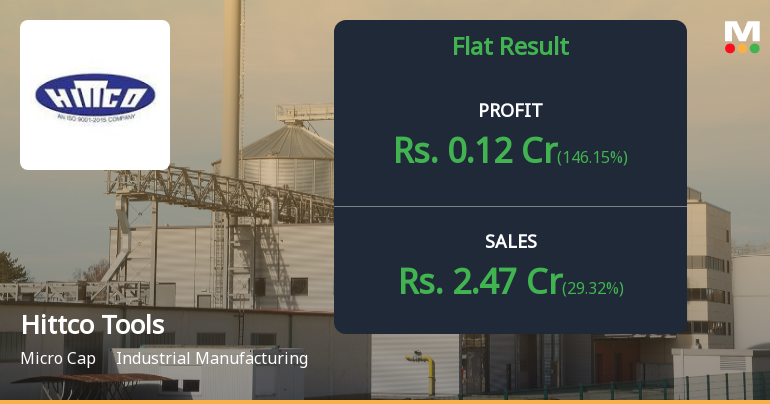
Hittco Tools Q4 FY26: Micro-Cap Manufacturer Returns to Profit After Three Consecutive Loss-Making Quarters
Hittco Tools Ltd., a Bangalore-based micro-cap manufacturer of carbide and high-speed steel cutting tools, reported a return to profitability in Q4 FY26 (Mar'26) with net profit of ₹0.12 crores, marking a dramatic turnaround from three consecutive quarters of losses. The stock surged 9.53% to ₹10.69 on June 01, 2026, though it remains down 15.83% over the past year and continues to trade 33.19% below its 52-week high of ₹16.00.
Read full news article Announcements
Shareholder Meeting / Postal Ballot-Notice of Postal Ballot
15-Jul-2026 | Source : BSEWe hereby submit the postal ballot Notice dated 15th July 2026together Explanatory Statement seeking approval of the member of the company through e-voting for Increase in authorized share capital.
Board Meeting Outcome for Outcome Of The Board Meeting Held On 15Th July 2026 Pursuant To Regulation 30 Of The SEBI (Listing Obligations And Disclosure Requirements) Regulations 2015
15-Jul-2026 | Source : BSEPursuant to Regulation 30 read with Schedule III and other applicable provisions of the SEBI (Listing Obligations and Disclosure Requirements) Regulations 2015 (SEBI LODR Regulations) we wish to inform you that the Board of Directors of HITTCO Tools Limited at its Meeting held today i.e. Wednesday 15th July 2026 at the Registered Office of the Company situated at No. 17-C KIADB Industrial Area 2nd Phase Peenya Bengaluru - 560058 has inter alia considered and approved the following: 1. Increase in Authorised Share Capital 2. Alteration of Memorandum of Association 3. Approval of Postal Ballot Notice 4. Cut-off Date 5. Appointment of Scrutinizer 6. Remote E-voting Schedule 7. Appointment of CDSL 8. Authorised Mr. Surendra Bhandari Managing Director of the Company. The meeting of the Board of Directors commenced at 3:00 P.M. (IST) and concluded at 3:15 P.M. (IST). Kindly take the above information on record.
Compliances-Certificate under Reg. 74 (5) of SEBI (DP) Regulations 2018
13-Jul-2026 | Source : BSEKindly find herewith attached Certificate under regulation 74(5) of the Securities and Exchange Board Of India ( Depository and Participants ) Regulations 2018 for the Quarter Ended on 30th June 2026.
Corporate Actions

No Upcoming Board Meetings

No Dividend history available

No Splits history available

No Bonus history available

No Rights history available
Quality key factors
Valuation key factors
Technicals key factors
 Technical Indicator Scale: Bearish, Mildly Bearish, Sideways, Mildly Bullish, Bullish Turned
 Shareholding Snapshot : May 2026
Shareholding Compare (%holding)
Non Institution
None
Held by 0 Schemes
Held by 0 FIIs
Surendra Bhandari (15.15%)
Dreambulls Partner Pvt Ltd (4.22%)
56.19%
Quarterly Results Snapshot (Standalone) - Mar'26 - QoQ

QoQ Growth in quarter ended Mar 2026 is 29.32% vs -6.37% in Dec 2025
QoQ Growth in quarter ended Mar 2026 is 146.15% vs -4.00% in Dec 2025
Half Yearly Results Snapshot (Standalone) - Sep'25
Growth in half year ended Sep 2025 is 38.95% vs -12.46% in Sep 2024
Growth in half year ended Sep 2025 is 15.87% vs -1,150.00% in Sep 2024
Nine Monthly Results Snapshot (Standalone) - Dec'25
YoY Growth in nine months ended Dec 2025 is 33.18% vs -6.43% in Dec 2024
YoY Growth in nine months ended Dec 2025 is 0.00% vs -8,000.00% in Dec 2024
Annual Results Snapshot (Standalone) - Mar'26
YoY Growth in year ended Mar 2026 is 16.55% vs 16.42% in Mar 2025

YoY Growth in year ended Mar 2026 is -7,000.00% vs -105.26% in Mar 2025
About Hittco Tools Ltd

Company Coordinates


