
Compare Orient Green with Similar Stocks
Dashboard
Weak Long Term Fundamental Strength with an average Return on Capital Employed (ROCE) of 6.53%
- Poor long term growth as Net Sales has grown by an annual rate of 2.83% and Operating profit at 6.51% over the last 5 years
- Low ability to service debt as the company has a high Debt to EBITDA ratio of 2.86 times
- OPERATING PROFIT TO INTEREST (Q) Lowest at 0.79 times
- PAT(Q) At Rs -17.99 cr has Fallen at -17.5%
- NET SALES(Q) At Rs 38.59 cr has Grown at -7.59%
With ROCE of 6.3, it has a Very Expensive valuation with a 1.1 Enterprise value to Capital Employed
99.99% of Promoter Shares are Pledged
Underperformed the market in the last 1 year
Total Returns (Price + Dividend) 
Orient Green for the last several years.
Risk Adjusted Returns v/s
Returns Beta

News

Orient Green Power Company Ltd Faces Bearish Momentum Amid Technical Downgrade
Orient Green Power Company Ltd, a micro-cap player in the power sector, has experienced a notable shift in its technical momentum, with key indicators signalling a bearish trend. Despite a strong historical return over five years, recent technical parameters reveal growing downside risks, prompting a downgrade in its Mojo Grade to Strong Sell as of 17 Nov 2025.
Read full news article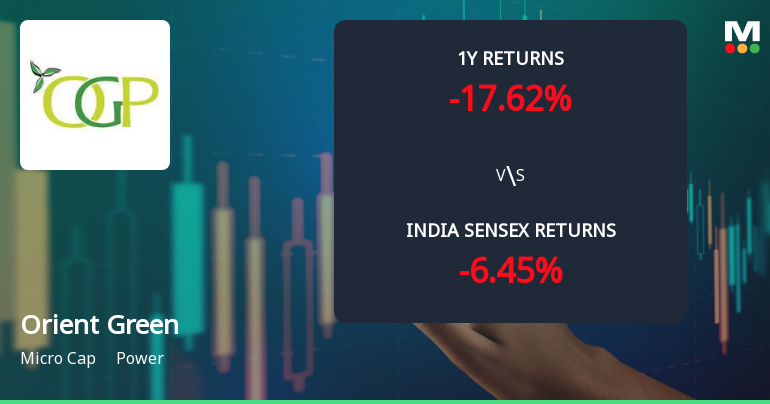
Orient Green Power Company Ltd Technical Momentum Shifts Amid Mixed Indicators
Orient Green Power Company Ltd has experienced a subtle shift in its technical momentum, moving from a bearish to a mildly bearish trend, as reflected in recent technical indicators. Despite a marginal day change of 0.09% and a current price of ₹11.13, the stock’s technical signals present a complex picture, with weekly indicators showing mild bullishness contrasting with monthly bearish trends. This nuanced technical landscape warrants a detailed analysis for investors navigating the power sector micro-cap.
Read full news article
Orient Green Power Company Ltd Faces Bearish Momentum Amid Mixed Technical Signals
Orient Green Power Company Ltd, a micro-cap player in the power sector, has seen its technical momentum shift towards a more bearish stance despite some mildly bullish weekly indicators. The company’s recent downgrade to a Strong Sell rating by MarketsMOJO reflects growing concerns over its price momentum and technical health amid a challenging market environment.
Read full news article Announcements
Announcement under Regulation 30 (LODR)-Newspaper Publication
27-Jun-2026 | Source : BSENewspaper Advertisement - Disclosure under Regulation 30 of SEBI (LODR) Regulations 2015
Intimation Under Regulation 30 Of The SEBI (Listing Obligations And Disclosure Requirements) Regulations 2015 (SEBI Listing Regulations) - Letter To Shareholders
27-Jun-2026 | Source : BSEA letter containing web-link of the Annual Report 2025-26 to those members who have not registered their email addresses with the Company/Depositories is enclosed herewith for your reference.
Reg. 34 (1) Annual Report.
26-Jun-2026 | Source : BSESubmission of Nineteenth Annual Report along with the Notice and information on Book closure as per Regulation 34 & 42 of SEBI (Listing Obligations and Disclosure Requirements) Regulations 2015
Corporate Actions

No Upcoming Board Meetings

No Dividend history available

No Splits history available

No Bonus history available

Orient Green Power Company Ltd has announced 10:51 rights issue, ex-date: 13 Aug 24
Quality key factors
Valuation key factors
Technicals key factors
 Technical Indicator Scale: Bearish, Mildly Bearish, Sideways, Mildly Bullish, Bullish Turned
 Shareholding Snapshot : Mar 2026
Shareholding Compare (%holding)
Non Institution
99.9937
Held by 0 Schemes
Held by 33 FIIs (0.79%)
Janati Bio Power Private Limited (24.38%)
Spv Finserve Private Limited (2.25%)
66.08%
Quarterly Results Snapshot (Consolidated) - Mar'26 - YoY

YoY Growth in quarter ended Mar 2026 is -7.59% vs 16.06% in Mar 2025
YoY Growth in quarter ended Mar 2026 is -9.67% vs 37.80% in Mar 2025
Half Yearly Results Snapshot (Consolidated) - Sep'25

Growth in half year ended Sep 2025 is 18.76% vs -8.50% in Sep 2024
Growth in half year ended Sep 2025 is 39.26% vs -5.41% in Sep 2024
Nine Monthly Results Snapshot (Consolidated) - Dec'25
YoY Growth in nine months ended Dec 2025 is 16.47% vs -7.05% in Dec 2024
YoY Growth in nine months ended Dec 2025 is 58.59% vs -11.97% in Dec 2024
Annual Results Snapshot (Consolidated) - Mar'26
YoY Growth in year ended Mar 2026 is 12.51% vs 0.34% in Mar 2025
YoY Growth in year ended Mar 2026 is 78.79% vs 6.24% in Mar 2025
About Orient Green Power Company Ltd

Company Coordinates


