
Compare Foseco Crucible with Similar Stocks
Dashboard
Flat results in Mar 26
- PBT LESS OI(Q) At Rs 6.81 cr has Fallen at -12.5% (vs previous 4Q average)
- NET SALES(Q) Lowest at Rs 37.35 cr
- NON-OPERATING INCOME(Q) is 46.12 % of Profit Before Tax (PBT)
With ROE of 26.8, it has a Expensive valuation with a 4.9 Price to Book Value
Below par performance in long term as well as near term
Stock DNA
Electrodes & Refractories
INR 675 Cr (Micro Cap)
18.00
36
1.60%
-0.11
26.84%
4.92
Total Returns (Price + Dividend) 
Latest dividend: 19 per share ex-dividend date: Aug-14-2025
Risk Adjusted Returns v/s
Returns Beta

News

Foseco Crucible (India) Ltd is Rated Sell
Foseco Crucible (India) Ltd is rated 'Sell' by MarketsMOJO, with this rating last updated on 05 Jan 2026. However, the analysis and financial metrics discussed here reflect the stock's current position as of 15 June 2026, providing investors with an up-to-date view of the company’s fundamentals, valuation, financial trends, and technical outlook.
Read full news article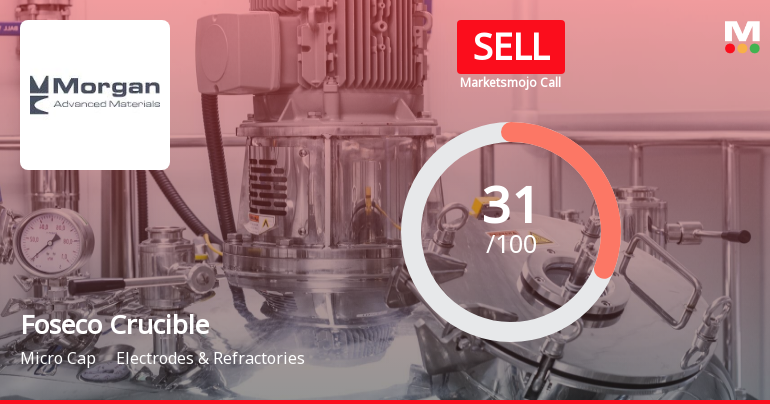
Foseco Crucible (India) Ltd is Rated Sell
Foseco Crucible (India) Ltd is rated 'Sell' by MarketsMOJO, with this rating last updated on 05 Jan 2026. However, all fundamentals, returns, and financial metrics discussed here reflect the stock's current position as of 04 June 2026, providing investors with an up-to-date analysis of the company’s performance and outlook.
Read full news article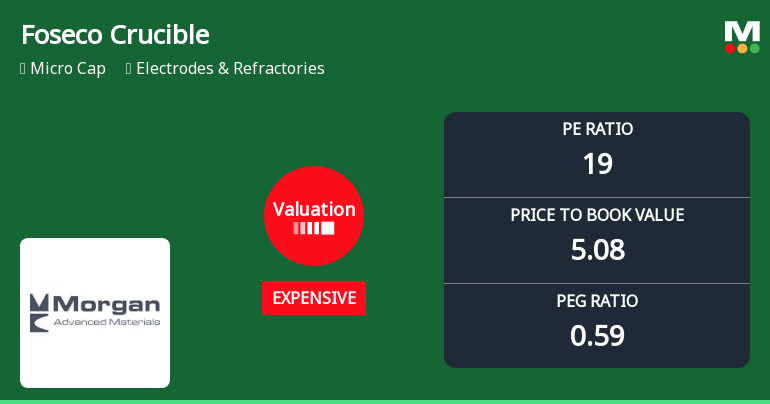
Foseco Crucible (India) Ltd Valuation Shifts Signal Price Attractiveness Change
Foseco Crucible (India) Ltd has experienced a notable shift in its valuation parameters, moving from a very expensive to an expensive rating, even as its stock price continues to lag behind broader market indices. This article analyses the recent changes in key valuation metrics, compares them with industry peers, and assesses the implications for investors amid the company’s ongoing market underperformance.
Read full news article Announcements
Compliances-Reg.24(A)-Annual Secretarial Compliance
29-May-2026 | Source : BSEAnnual Secretarial Compliance report attached
Intimation Of Proposed Sale Of Certain Equity Shares Of The Company By The Holding Company Foseco India Limited In The Open Market To Achieve Minimum Public Shareholding
15-May-2026 | Source : BSEEnclosed
Announcement under Regulation 30 (LODR)-Newspaper Publication
06-May-2026 | Source : BSENewspaper publication in BS & Sakal
Corporate Actions

No Upcoming Board Meetings

Foseco Crucible (India) Ltd has declared 380% dividend, ex-date: 14 Aug 25

Foseco Crucible (India) Ltd has announced 5:10 stock split, ex-date: 31 Aug 20

No Bonus history available

No Rights history available
Quality key factors
Valuation key factors
Technicals key factors
 Technical Indicator Scale: Bearish, Mildly Bearish, Sideways, Mildly Bullish, Bullish Turned
 Shareholding Snapshot : Mar 2026
Shareholding Compare (%holding)
Promoters
None
Held by 0 Schemes
Held by 1 FIIs (0.16%)
Foseco India Limited (76.77%)
None
19.37%
Quarterly Results Snapshot (Standalone) - Mar'26 - QoQ

QoQ Growth in quarter ended Mar 2026 is -18.96% vs 0.35% in Dec 2025
QoQ Growth in quarter ended Mar 2026 is -125.13% vs -36.56% in Dec 2025
Half Yearly Results Snapshot (Standalone) - Sep'25

Growth in half year ended Sep 2025 is 1.46% vs -0.95% in Sep 2024
Growth in half year ended Sep 2025 is -13.44% vs 4.28% in Sep 2024
Nine Monthly Results Snapshot (Standalone) - Dec'25
YoY Growth in nine months ended Dec 2025 is 2.05% vs 2.98% in Dec 2024
YoY Growth in nine months ended Dec 2025 is -18.41% vs 8.21% in Dec 2024
Annual Results Snapshot (Standalone) - Mar'26
YoY Growth in year ended Mar 2026 is -1.30% vs 3.73% in Mar 2025
YoY Growth in year ended Mar 2026 is -32.03% vs 17.24% in Mar 2025
About Foseco Crucible (India) Ltd

Company Coordinates


