
Compare Morganite Crucib with Similar Stocks
Dashboard
With ROE of 18.3, it has a Expensive valuation with a 5 Price to Book Value
- The stock is trading at a premium compared to its peers' average historical valuations
- Over the past year, while the stock has generated a return of -7.39%, its profits have fallen by -8.6%
Despite the size of the company, domestic mutual funds hold only 0% of the company
Below par performance in long term as well as near term
Stock DNA
Electrodes & Refractories
INR 689 Cr (Micro Cap)
27.00
37
1.54%
-0.11
18.26%
5.10
Total Returns (Price + Dividend) 
Latest dividend: 19 per share ex-dividend date: Aug-14-2025
Risk Adjusted Returns v/s
Returns Beta

News
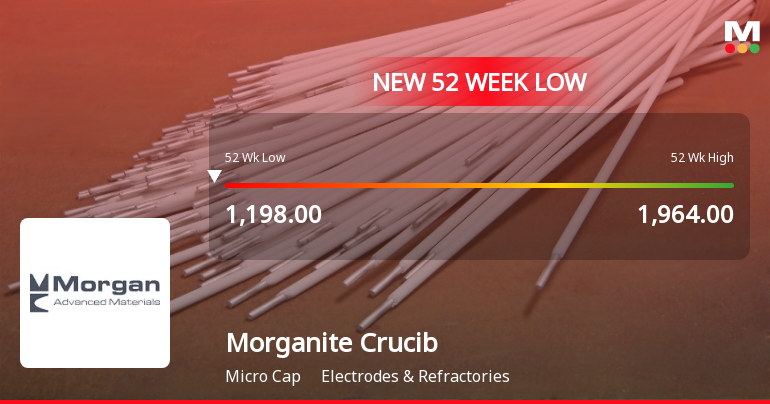
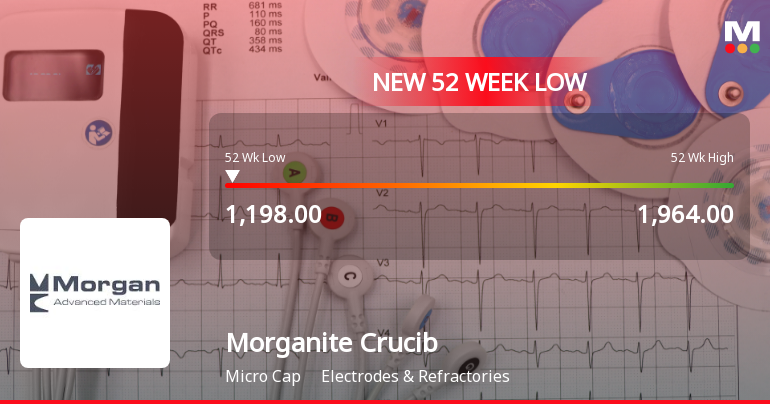
Morganite Crucible Falls to 52-Week Low of Rs 1190 as Sell-Off Deepens
A sharp decline of 6.73% today dragged Morganite Crucible (India) Ltd to a fresh 52-week low of Rs 1190, marking a significant setback amid a broader market downturn. This fall comes despite pockets of positive financial data, underscoring a complex interplay of valuation concerns and market sentiment.
Read full news article
Morganite Crucible (India) Ltd is Rated Sell
Morganite Crucible (India) Ltd is rated 'Sell' by MarketsMOJO, with this rating last updated on 05 Jan 2026. However, the analysis and financial metrics discussed here reflect the stock's current position as of 19 March 2026, providing investors with the latest insights into its performance and outlook.
Read full news article Announcements
Additional Details Required For Corporate Announcement Filed Under Regulation 30 Of SEBI (LODR) Regulations 2015 On 11-Feb-2026 08:18:06 PM Announcement Under Regulation 30 (LODR)-Resignation Of Chief Financial Officer (CFO)
06-Mar-2026 | Source : BSEThis is with reference to Corporate Announcement submitted by company dated 11-Feb-2026 08:18:06 PM under Regulation 30 of SEBI (Listing Obligations and Disclosure Requirements) Regulations 2015 regarding the submission of the resignation letter of the Chief Financial Officer (CFO).
Announcement under Regulation 30 (LODR)-Newspaper Publication
13-Feb-2026 | Source : BSENewspaper Publication
Disclosure Under Regulation 33 (3) (A) Of SEBI (Listing Obligation & Disclosure Requirements) Regulations 2015 For The Third Quarter Ended Dec 31 2025
12-Feb-2026 | Source : BSEPlease find enclosed herewith the Unaudited Financial Results for the third quarter ended on December 31 2025 along with limited review report pursuant to Regulation 33(3)(a) of SEBI (Listing Obligation and Disclosure Requirements) Regulation 2015 which were approved & taken on record by the Board of Directors of the Company at their meeting held on 11th February 2026.
Corporate Actions

No Upcoming Board Meetings

Morganite Crucible (India) Ltd has declared 380% dividend, ex-date: 14 Aug 25

Morganite Crucible (India) Ltd has announced 5:10 stock split, ex-date: 31 Aug 20

No Bonus history available

No Rights history available
Quality key factors
Valuation key factors
Technicals key factors
 Technical Indicator Scale: Bearish, Mildly Bearish, Sideways, Mildly Bullish, Bullish Turned
 Shareholding Snapshot : Dec 2025
Shareholding Compare (%holding)
Promoters
None
Held by 1 Schemes (0.0%)
Held by 1 FIIs (0.16%)
Foseco India Limited (75.0%)
Pgim India Equity Growth Opportunities Fund-series I (1.17%)
20.12%
Quarterly Results Snapshot (Standalone) - Dec'25 - QoQ

QoQ Growth in quarter ended Dec 2025 is 0.35% vs 7.97% in Sep 2025
QoQ Growth in quarter ended Dec 2025 is -36.56% vs 52.17% in Sep 2025
Half Yearly Results Snapshot (Standalone) - Sep'25

Growth in half year ended Sep 2025 is 1.46% vs -0.95% in Sep 2024
Growth in half year ended Sep 2025 is -13.44% vs 4.28% in Sep 2024
Nine Monthly Results Snapshot (Standalone) - Dec'25
YoY Growth in nine months ended Dec 2025 is 2.05% vs 2.98% in Dec 2024
YoY Growth in nine months ended Dec 2025 is -18.41% vs 8.21% in Dec 2024
Annual Results Snapshot (Standalone) - Mar'25
YoY Growth in year ended Mar 2025 is 3.73% vs 8.63% in Mar 2024
YoY Growth in year ended Mar 2025 is 17.24% vs 45.72% in Mar 2024
About Morganite Crucible (India) Ltd

Company Coordinates


