
Compare Refex Industries with Similar Stocks
Dashboard
Strong ability to service debt as the company has a low Debt to EBITDA ratio of 0.63 times
Healthy long term growth as Net Sales has grown by an annual rate of 28.71% and Operating profit at 59.51%
Positive results in Mar 26
With ROE of 15.4, it has a Attractive valuation with a 3 Price to Book Value
43.51% of Promoter Shares are Pledged
Underperformed the market in the last 1 year
Stock DNA
Other Chemical products
INR 4,309 Cr (Small Cap)
19.00
22
0.45%
-0.11
15.43%
3.00
Total Returns (Price + Dividend) 
Latest dividend: 0.9995259165613148 per share ex-dividend date: Jul-24-2026
Risk Adjusted Returns v/s
Returns Beta

News

Refex Industries Ltd is Rated Hold by MarketsMOJO
Refex Industries Ltd is rated 'Hold' by MarketsMOJO, with this rating last updated on 06 July 2026. However, the analysis and financial metrics discussed here reflect the stock’s current position as of 29 July 2026, providing investors with an up-to-date perspective on the company’s fundamentals, valuation, financial trends, and technical outlook.
Read full news articleWhen is the next results date for Refex Industries Ltd?
Refex Industries Ltd is scheduled to declare its results on 29 July 2026....
Read full news article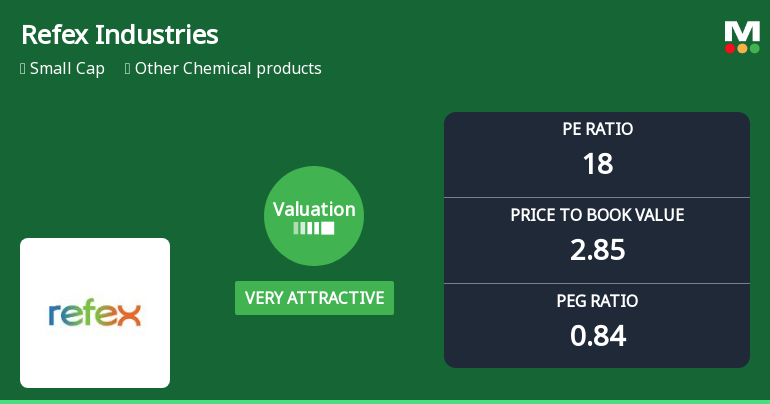
Refex Industries Ltd Valuation Shifts Signal Renewed Price Attractiveness
Refex Industries Ltd has witnessed a significant shift in its valuation parameters, moving from an attractive to a very attractive rating, reflecting a compelling change in price attractiveness for investors. Despite a recent downgrade in its overall Mojo Grade from Buy to Hold, the company’s valuation metrics now present a more favourable entry point compared to historical and peer averages within the Other Chemical products sector.
Read full news article Announcements
Announcement under Regulation 30 (LODR)-Analyst / Investor Meet - Intimation
24-Jul-2026 | Source : BSEIntimation of Earnings Call for the 1st Quarter ended June 30 2026 - Q1 FY27
Board Meeting Intimation for Consideration & Approval Of The Unaudited Standalone & Consolidated Financial Results Of The Company For The 1St Quarter Ended June 30 2026 Of The Financial Year 2026-27
23-Jul-2026 | Source : BSERefex Industries Ltdhas informed BSE that the meeting of the Board of Directors of the Company is scheduled on 29/07/2026 inter alia to consider and approve the Unaudited Standalone & Consolidated Financial Results of the Company for the 1st Quarter ended June 30 2026 of the Financial Year 2026-27.
Compliances-Certificate under Reg. 74 (5) of SEBI (DP) Regulations 2018
10-Jul-2026 | Source : BSECertificate under Regulation 74(5) of the SEBI (Depositories and Participants) Regulations 2018 for the 1st Quarter ended June 30 2026 for FY 2026-27
Corporate Actions

(29 Jul 2026)

Refex Industries Ltd has declared 50% dividend, ex-date: 24 Jul 26

Refex Industries Ltd has announced 2:10 stock split, ex-date: 22 Mar 24

No Bonus history available

Refex Industries Ltd has announced 5:14 rights issue, ex-date: 16 Jun 20
Quality key factors
Valuation key factors
Technicals key factors
 Technical Indicator Scale: Bearish, Mildly Bearish, Sideways, Mildly Bullish, Bullish Turned
 Shareholding Snapshot : Jun 2026
Shareholding Compare (%holding)
Promoters
43.5135
Held by 5 Schemes (0.13%)
Held by 18 FIIs (0.93%)
Refex Holding Private Limited (56.57%)
Network18 Media And Investments Limited (1%)
32.55%
Quarterly Results Snapshot (Consolidated) - Mar'26 - YoY

YoY Growth in quarter ended Mar 2026 is 57.14% vs 73.64% in Mar 2025

YoY Growth in quarter ended Mar 2026 is 87.96% vs 41.00% in Mar 2025
Half Yearly Results Snapshot (Consolidated) - Sep'25
Growth in half year ended Sep 2025 is -21.77% vs 37.97% in Sep 2024
Growth in half year ended Sep 2025 is -2.98% vs 41.44% in Sep 2024
Nine Monthly Results Snapshot (Consolidated) - Dec'25
YoY Growth in nine months ended Dec 2025 is -19.45% vs 63.33% in Dec 2024
YoY Growth in nine months ended Dec 2025 is 1.87% vs 85.34% in Dec 2024
Annual Results Snapshot (Consolidated) - Mar'26
YoY Growth in year ended Mar 2026 is 0.77% vs 63.39% in Mar 2025
YoY Growth in year ended Mar 2026 is 28.07% vs 69.15% in Mar 2025
About Refex Industries Ltd

Company Coordinates


