
Compare PCBL Chemical with Similar Stocks
Dashboard
The company has declared Negative results for the last 3 consecutive quarters
- PBT LESS OI(Q) At Rs 51.92 cr has Fallen at -31.2% (vs previous 4Q average)
- PAT(Q) At Rs 43.47 cr has Fallen at -33.6% (vs previous 4Q average)
- ROCE(HY) Lowest at 7.88%
Underperformed the market in the last 1 year
Stock DNA
Other Chemical products
INR 12,309 Cr (Small Cap)
60.00
36
1.87%
1.17
5.12%
3.03
Total Returns (Price + Dividend) 
Latest dividend: 6 per share ex-dividend date: Oct-27-2025
Risk Adjusted Returns v/s
Returns Beta

News
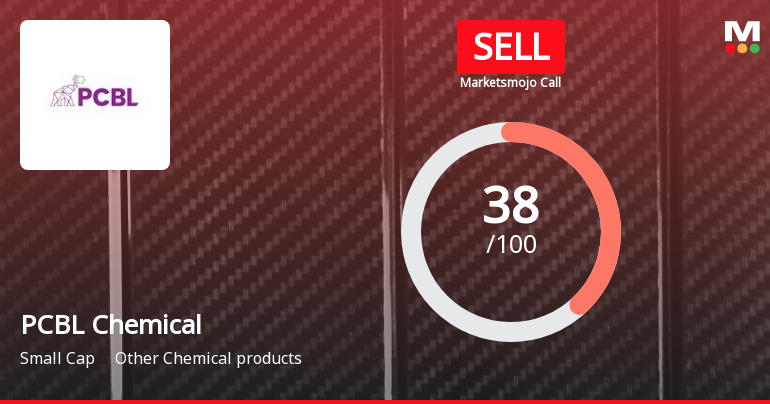
PCBL Chemical Ltd is Rated Sell
PCBL Chemical Ltd is rated 'Sell' by MarketsMOJO, with this rating last updated on 23 July 2025. However, the analysis and financial metrics discussed here reflect the stock's current position as of 24 June 2026, providing investors with an up-to-date view of the company’s performance and outlook.
Read full news article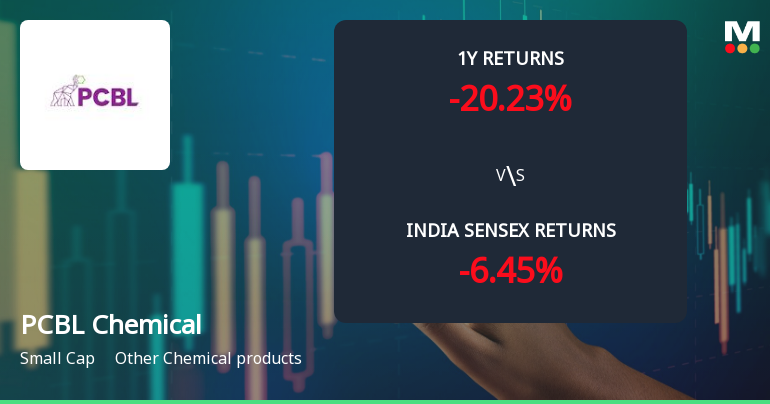
PCBL Chemical Ltd Technical Momentum Shifts Amid Mixed Indicator Signals
PCBL Chemical Ltd, a small-cap player in the Other Chemical products sector, has experienced a notable shift in its technical momentum, moving from a sideways trend to a mildly bearish stance. Despite a modest day gain of 0.76%, the stock’s technical indicators present a complex picture, with some signals suggesting bullish tendencies while others point to caution. This article analyses the recent technical parameter changes, key momentum indicators, and their implications for investors.
Read full news article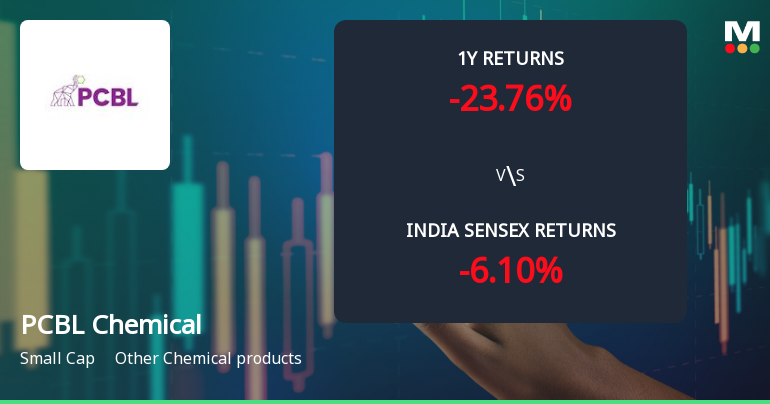
PCBL Chemical Ltd Technical Momentum Shifts Amid Mixed Market Signals
PCBL Chemical Ltd has exhibited a notable shift in its technical momentum, moving from a mildly bearish stance to a sideways trend as of mid-2026. Despite a recent upgrade in short-term price action, the stock’s technical indicators present a complex picture, with some oscillators signalling bullish tendencies while others remain subdued or bearish. This nuanced technical landscape warrants a detailed analysis for investors seeking clarity on PCBL’s near-term prospects within the Other Chemical products sector.
Read full news article Announcements
Re-Lodgement Of Transfer Requests Of Physical Shares
12-Jun-2026 | Source : BSERe-lodgement of Transfer Requests of Physical Shares
Disclosure Under Regulation 30 Of The SEBI ( Listing Obligations And Disclosure Requirements) Regulations 2015 (SEBI Listing Regulations)
11-Jun-2026 | Source : BSECommissioning of a new specialty production line with a gross capacity of 20000 MTPA at its Mundra Plant in Gujarat
Announcement under Regulation 30 (LODR)-Newspaper Publication
10-Jun-2026 | Source : BSESpecial Window for Transfer and Dematerialization of Physical Securities
Corporate Actions

No Upcoming Board Meetings

PCBL Chemical Ltd has declared 600% dividend, ex-date: 27 Oct 25

PCBL Chemical Ltd has announced 1:2 stock split, ex-date: 11 Apr 22

No Bonus history available

No Rights history available
Quality key factors
Valuation key factors
Technicals key factors
 Technical Indicator Scale: Bearish, Mildly Bearish, Sideways, Mildly Bullish, Bullish Turned
 Shareholding Snapshot : Mar 2026
Shareholding Compare (%holding)
Promoters
None
Held by 17 Schemes (5.52%)
Held by 105 FIIs (5.56%)
Rainbow Investments Limited (47.43%)
Life Insurance Corporation Of India (2.7%)
22.67%
Quarterly Results Snapshot (Consolidated) - Mar'26 - QoQ

QoQ Growth in quarter ended Mar 2026 is 11.94% vs -14.70% in Dec 2025
QoQ Growth in quarter ended Mar 2026 is 1,882.76% vs -96.70% in Dec 2025
Half Yearly Results Snapshot (Consolidated) - Sep'25

Growth in half year ended Sep 2025 is -0.68% vs 51.96% in Sep 2024
Growth in half year ended Sep 2025 is -35.54% vs 4.13% in Sep 2024
Nine Monthly Results Snapshot (Consolidated) - Dec'25
YoY Growth in nine months ended Dec 2025 is -3.06% vs 40.65% in Dec 2024
YoY Growth in nine months ended Dec 2025 is -52.87% vs -11.92% in Dec 2024
Annual Results Snapshot (Consolidated) - Mar'26
YoY Growth in year ended Mar 2026 is -2.56% vs 30.91% in Mar 2025
YoY Growth in year ended Mar 2026 is -54.47% vs -11.48% in Mar 2025
About PCBL Chemical Ltd

Company Coordinates


