
Compare Ellen.Indl.Gas with Similar Stocks
Dashboard
Flat results in Mar 26
- INTEREST(Q) At Rs 2.33 cr has Grown at 56.38%
- PAT(Q) At Rs 22.88 cr has Fallen at -8.3% (vs previous 4Q average)
- NON-OPERATING INCOME(Q) is 43.71 % of Profit Before Tax (PBT)
With ROE of 11.3, it has a Very Expensive valuation with a 4.3 Price to Book Value
Falling Participation by Institutional Investors
Below par performance in long term as well as near term
Stock DNA
Other Chemical products
INR 4,001 Cr (Small Cap)
38.00
22
0.00%
-0.06
11.32%
4.30
Total Returns (Price + Dividend) 
Latest dividend: 0.5000 per share ex-dividend date: Sep-17-2012
Risk Adjusted Returns v/s
Returns Beta

News
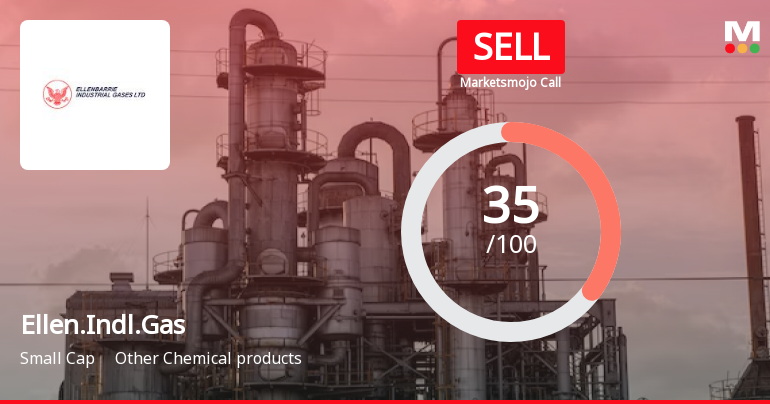
Ellenbarrie Industrial Gases Ltd is Rated Sell
Ellenbarrie Industrial Gases Ltd is rated 'Sell' by MarketsMOJO, with this rating last updated on 22 December 2025. However, the analysis and financial metrics presented here reflect the stock's current position as of 17 July 2026, providing investors with an up-to-date view of the company’s fundamentals, valuation, financial trends, and technical outlook.
Read full news article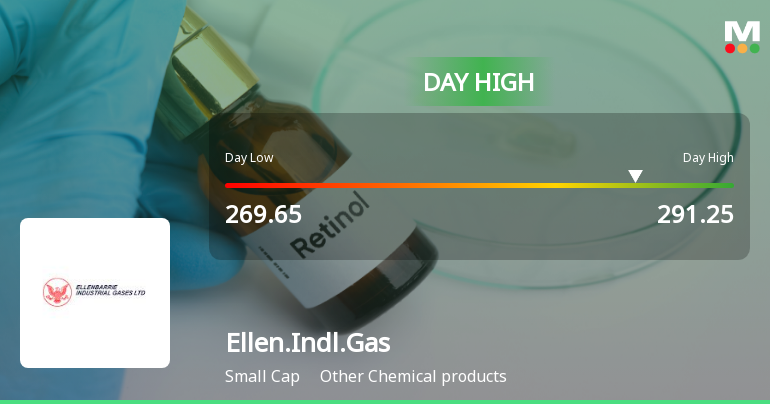
Ellenbarrie Industrial Gases Ltd Surges 7.36% to Day's High of Rs 290.95 — Outperforms Sector by 7.62 Percentage Points
The Sensex gained 0.99% on 10 Jul 2026, yet Ellenbarrie Industrial Gases Ltd outpaced the broader market with a 7.36% rise, touching an intraday high of Rs 290.95. This 7.62 percentage-point outperformance over its sector signals a distinctly stock-specific rally rather than a market-wide lift.
Read full news article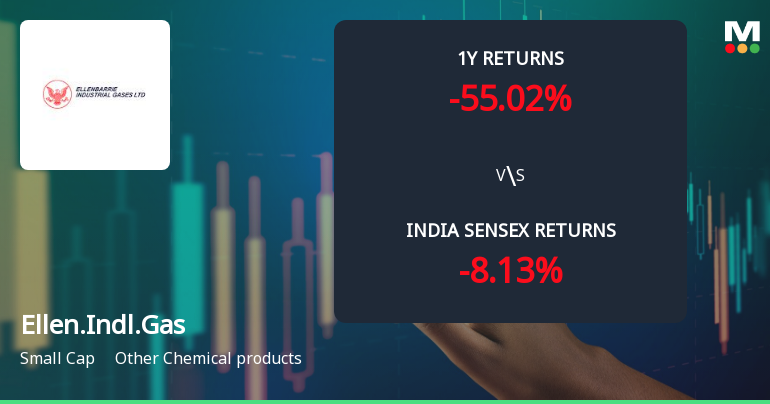
Ellenbarrie Industrial Gases Ltd Sees Mixed Technical Signals Amid Price Momentum Shift
Ellenbarrie Industrial Gases Ltd has experienced a notable shift in price momentum and technical indicators, reflecting a complex market stance for this small-cap player in the Other Chemical products sector. Despite a recent 5.23% intraday gain, the stock’s technical landscape remains mixed, with some indicators signalling mild bullishness while others suggest caution.
Read full news article Announcements
Corporate Actions

No Upcoming Board Meetings

Ellenbarrie Industrial Gases Ltd has declared 5% dividend, ex-date: 17 Sep 12

No Splits history available

No Bonus history available

No Rights history available
Quality key factors
Valuation key factors
Technicals key factors
 Technical Indicator Scale: Bearish, Mildly Bearish, Sideways, Mildly Bullish, Bullish Turned
 Shareholding Snapshot : Jun 2026
Shareholding Compare (%holding)
Promoters
None
Held by 9 Schemes (9.57%)
Held by 10 FIIs (1.08%)
Padam Kumar Agarwala (48.84%)
Motilal Oswal Nifty Microcap 250 Index Fund (5.54%)
7.16%
Quarterly Results Snapshot (Standalone) - Mar'26 - QoQ

QoQ Growth in quarter ended Mar 2026 is 7.47% vs -8.77% in Dec 2025
QoQ Growth in quarter ended Mar 2026 is -12.30% vs -28.95% in Dec 2025
Half Yearly Results Snapshot (Standalone) - Sep'25
Not Applicable: The company has declared_date for only one period
Not Applicable: The company has declared_date for only one period
Nine Monthly Results Snapshot (Standalone) - Dec'25
Not Applicable: The company has declared_date for only one period
Not Applicable: The company has declared_date for only one period
Annual Results Snapshot (Standalone) - Mar'26

YoY Growth in year ended Mar 2026 is 9.31% vs 15.96% in Mar 2025
YoY Growth in year ended Mar 2026 is 25.35% vs 83.90% in Mar 2025
About Ellenbarrie Industrial Gases Ltd

Company Coordinates


