
Compare Refex Industries with Similar Stocks
Stock DNA
Other Chemical products
INR 4,552 Cr (Small Cap)
20.00
23
0.15%
-0.11
15.43%
2.91
Total Returns (Price + Dividend) 
Latest dividend: 0.5 per share ex-dividend date: Aug-19-2025
Risk Adjusted Returns v/s
Returns Beta

News

Refex Industries Ltd is Rated Sell
Refex Industries Ltd is rated Sell by MarketsMOJO, with this rating last updated on 01 June 2026. However, the analysis and financial metrics discussed below reflect the stock’s current position as of 20 June 2026, providing investors with the latest insights into the company’s performance and outlook.
Read full news article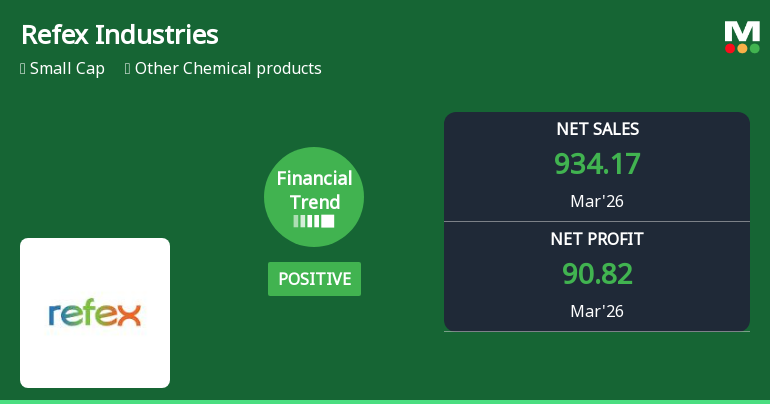
Refex Industries Ltd Reports Strong Quarterly Upswing Amid Market Volatility
Refex Industries Ltd, a small-cap player in the Other Chemical products sector, has demonstrated a marked improvement in its financial performance for the quarter ended March 2026. The company’s financial trend has shifted from flat to positive, driven by record-breaking revenue and profitability metrics, signalling a potential turnaround despite recent market headwinds.
Read full news article
Refex Industries Ltd Reports Mixed Quarterly Results Amid Margin Pressure
Refex Industries Ltd, a small-cap player in the Other Chemical products sector, has delivered its highest quarterly financial performance in recent times, with significant improvements in revenue, profitability, and cash reserves. Despite this, the company’s overall financial trend has shifted from positive to flat, prompting a downgrade in its Mojo Grade from Hold to Sell as of 1 June 2026.
Read full news article Announcements
Refex Industries Limited - Press Release
23-Oct-2019 | Source : NSERefex Industries Limited has informed the Exchange regarding a press release dated October 22, 2019, titled "Press Release " to protect the interest of the Investors and Stakeholders of the Company.
Refex Industries Limited - Amendment to AOA/MOA
22-Oct-2019 | Source : NSERefex Industries Limited has informed the Exchange regarding the Amendment to AOA/MOA of the company.
AGM\/Book Closure
03-Sep-2019 | Source : NSE
| Refex Industries Limited has informed the Exchange that the Register of Members & Share Transfer Books of the Company will remain closed from September 26, 2019 to September 30, 2019(both days inclusive) for the purpose of of Annual General Meeting of the Company to be held on September 30, 2019 |
Corporate Actions

No Upcoming Board Meetings

Refex Industries Ltd has declared 25% dividend, ex-date: 19 Aug 25

Refex Industries Ltd has announced 2:10 stock split, ex-date: 22 Mar 24

No Bonus history available

Refex Industries Ltd has announced 5:14 rights issue, ex-date: 16 Jun 20
Quality key factors
Valuation key factors
Technicals key factors
 Technical Indicator Scale: Bearish, Mildly Bearish, Sideways, Mildly Bullish, Bullish Turned
 Shareholding Snapshot : May 2026
Shareholding Compare (%holding)
Promoters
41.2891
Held by 5 Schemes (0.13%)
Held by 18 FIIs (1.65%)
Refex Holding Private Limited (55.85%)
Network18 Media And Investments Ltd (1%)
32.77%
Quarterly Results Snapshot (Consolidated) - Mar'26 - YoY

YoY Growth in quarter ended Mar 2026 is 57.14% vs 73.64% in Mar 2025

YoY Growth in quarter ended Mar 2026 is 87.96% vs 41.00% in Mar 2025
Half Yearly Results Snapshot (Consolidated) - Sep'25
Growth in half year ended Sep 2025 is -21.77% vs 37.97% in Sep 2024
Growth in half year ended Sep 2025 is -2.98% vs 41.44% in Sep 2024
Nine Monthly Results Snapshot (Consolidated) - Dec'25
YoY Growth in nine months ended Dec 2025 is -19.45% vs 63.33% in Dec 2024
YoY Growth in nine months ended Dec 2025 is 1.87% vs 85.34% in Dec 2024
Annual Results Snapshot (Consolidated) - Mar'26
YoY Growth in year ended Mar 2026 is 0.77% vs 63.39% in Mar 2025
YoY Growth in year ended Mar 2026 is 28.07% vs 69.15% in Mar 2025
About Refex Industries Ltd

Company Coordinates


