
Compare MRF with Similar Stocks
Dashboard
Company has a Debt to Equity ratio (avg) of 0.02 times
Healthy long term growth as Net Sales has grown by an annual rate of 14.02%
The company has declared Positive results for the last 3 consecutive quarters
With ROE of 11.8, it has a Attractive valuation with a 2.7 Price to Book Value
High Institutional Holdings at 30.24%
Below par performance in long term as well as near term
Stock DNA
Tyres & Rubber Products
INR 57,171 Cr (Mid Cap)
23.00
21
0.18%
-0.10
11.78%
2.67
Total Returns (Price + Dividend) 
Latest dividend: 3.0009067340246864 per share ex-dividend date: Feb-13-2026
Risk Adjusted Returns v/s
Returns Beta

News
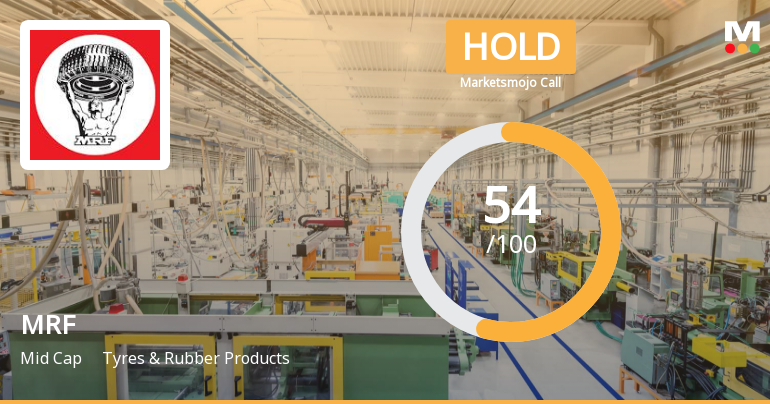
MRF Ltd. is Rated Hold by MarketsMOJO
MRF Ltd. is rated 'Hold' by MarketsMOJO, with this rating last updated on 03 July 2026. However, the analysis and financial metrics discussed here reflect the stock's current position as of 04 July 2026, providing investors with an up-to-date view of the company’s fundamentals, valuation, financial trends, and technical outlook.
Read full news article
MRF Ltd. is Rated Sell by MarketsMOJO
MRF Ltd. is rated 'Sell' by MarketsMOJO, with this rating last updated on 28 April 2026. However, the analysis and financial metrics discussed here reflect the stock's current position as of 23 June 2026, providing investors with the latest insights into the company’s performance and outlook.
Read full news article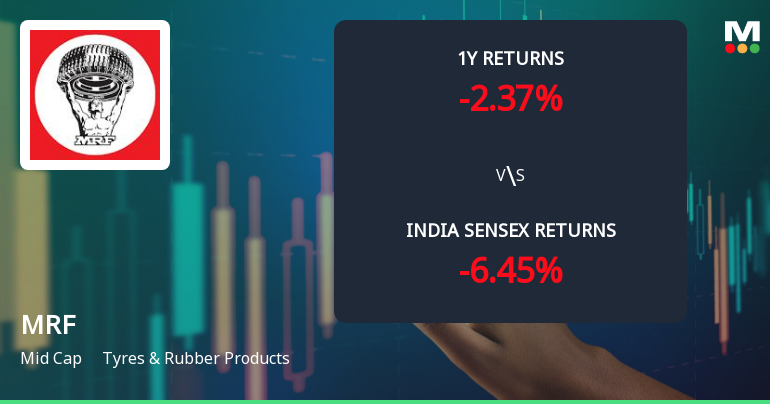
MRF Ltd. Technical Momentum Shifts Amid Mixed Indicator Signals
MRF Ltd., a leading player in the Tyres & Rubber Products sector, has experienced a notable shift in its technical momentum, reflecting a complex interplay of bullish and bearish signals across key indicators. Despite a recent upgrade from a Hold to a Sell rating by MarketsMOJO on 28 April 2026, the stock’s price action and technical parameters suggest a cautiously evolving trend that investors should closely monitor.
Read full news article Announcements
Intimation Of Record Date For Final Dividend
29-Jun-2026 | Source : BSEDetails Attached
Closure of Trading Window
29-Jun-2026 | Source : BSETrading Window Closure Intimation
Intimation Of Annual General Meeting And Record Date
29-Jun-2026 | Source : BSEDetails Attached
Corporate Actions

No Upcoming Board Meetings

MRF Ltd. has declared 2290% dividend, ex-date: 17 Jul 26

No Splits history available

No Bonus history available

No Rights history available
Quality key factors
Valuation key factors
Technicals key factors
 Technical Indicator Scale: Bearish, Mildly Bearish, Sideways, Mildly Bullish, Bullish Turned
 Shareholding Snapshot : Mar 2026
Shareholding Compare (%holding)
Non Institution
0.0934
Held by 115 Schemes (7.74%)
Held by 604 FIIs (17.98%)
Comprehensive Investment And Finance Company Pvt. Ltd. (10.42%)
Mowi Foundation (11.98%)
12.52%
Quarterly Results Snapshot (Consolidated) - Mar'26 - QoQ

QoQ Growth in quarter ended Mar 2026 is -0.08% vs 9.10% in Dec 2025
QoQ Growth in quarter ended Mar 2026 is 1.10% vs 32.14% in Dec 2025
Half Yearly Results Snapshot (Consolidated) - Sep'25
Growth in half year ended Sep 2025 is 6.94% vs 11.22% in Sep 2024

Growth in half year ended Sep 2025 is -1.50% vs -11.37% in Sep 2024
Nine Monthly Results Snapshot (Consolidated) - Dec'25
YoY Growth in nine months ended Dec 2025 is 9.61% vs 12.00% in Dec 2024
YoY Growth in nine months ended Dec 2025 is 26.79% vs -19.46% in Dec 2024
Annual Results Snapshot (Consolidated) - Mar'26
YoY Growth in year ended Mar 2026 is 10.64% vs 11.85% in Mar 2025
YoY Growth in year ended Mar 2026 is 29.51% vs -9.99% in Mar 2025
About MRF Ltd.

Company Coordinates


