
Compare Sh. Krishna Pap. with Similar Stocks
Stock DNA
Paper, Forest & Jute Products
INR 131 Cr (Micro Cap)
40.00
17
0.00%
0.84
8.67%
3.48
Total Returns (Price + Dividend) 
Sh. Krishna Pap. for the last several years.
Risk Adjusted Returns v/s
Returns Beta

News
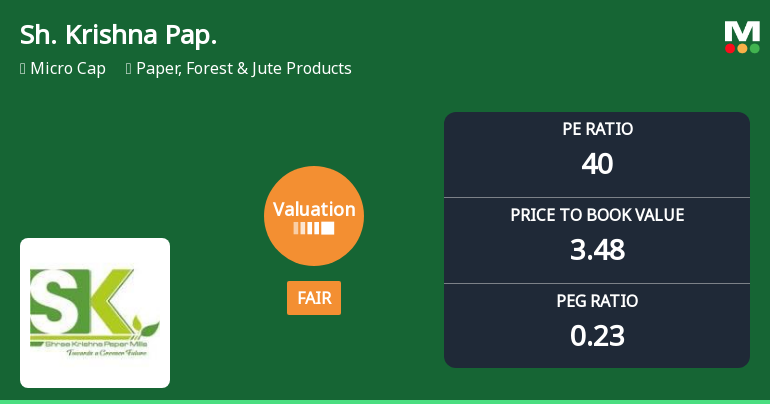
Shree Krishna Paper Mills & Industries Ltd: Valuation Shift Signals Changing Price Attractiveness
Shree Krishna Paper Mills & Industries Ltd has witnessed a notable shift in its valuation parameters, moving from an expensive to a fair valuation grade as of 11 May 2026. Despite a recent decline in share price, the company’s price-to-earnings (P/E) and price-to-book value (P/BV) ratios now present a more balanced picture relative to its historical averages and peer group, signalling a potential recalibration of investor sentiment in the paper, forest and jute products sector.
Read full news article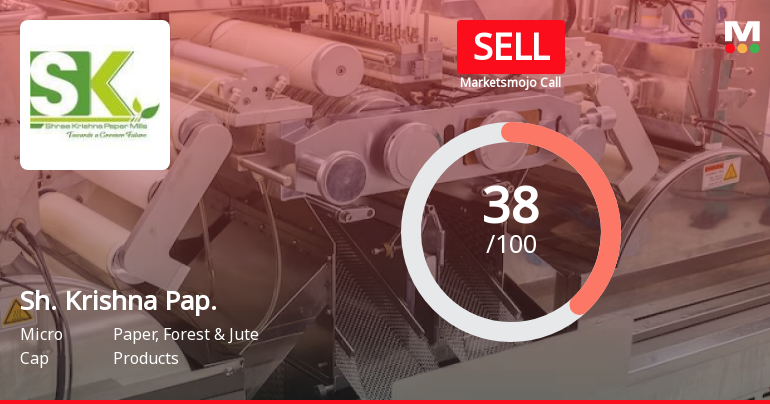
Shree Krishna Paper Mills & Industries Ltd is Rated Sell
Shree Krishna Paper Mills & Industries Ltd is rated 'Sell' by MarketsMOJO, with this rating last updated on 29 May 2026. However, the analysis and financial metrics discussed here reflect the stock's current position as of 26 June 2026, providing investors with the latest insights into the company’s performance and outlook.
Read full news article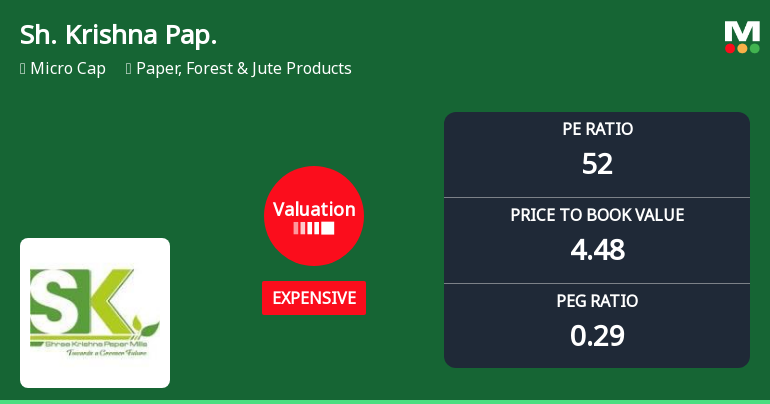
Shree Krishna Paper Mills & Industries Ltd: Valuation Shifts Signal Price Attractiveness Change
Shree Krishna Paper Mills & Industries Ltd has experienced a notable shift in its valuation parameters, moving from a very expensive to an expensive rating. This change reflects evolving market perceptions and impacts the stock’s price attractiveness amid a challenging sector backdrop and mixed financial metrics.
Read full news article Announcements
Closure of Trading Window
25-Jun-2026 | Source : BSEIntimation for Closure of Trading Window.
Announcement under Regulation 30 (LODR)-Newspaper Publication
30-May-2026 | Source : BSENewspaper Publication for Audited Financial Results for Quarter and Financial Year ended on March 312026.
Board Meeting Outcome for Outcome Of Board Meeting
29-May-2026 | Source : BSEDisclosure under Regulation 30 and 33 of the SEBI (Listing Obligations and Disclosure Requirements) Regulations 2015 (Listing Regulations) in respect of Outcome of Board Meeting held today i.e Friday May 29 2026
Corporate Actions

No Upcoming Board Meetings

No Dividend history available

No Splits history available

No Bonus history available

No Rights history available
Quality key factors
Valuation key factors
Technicals key factors
 Technical Indicator Scale: Bearish, Mildly Bearish, Sideways, Mildly Bullish, Bullish Turned
 Shareholding Snapshot : Mar 2026
Shareholding Compare (%holding)
Non Institution
84.3807
Held by 0 Schemes
Held by 0 FIIs
Bishwanath Industries Limited (15.14%)
Vijay Kumar Gupta (14.79%)
4.91%
Quarterly Results Snapshot (Standalone) - Mar'26 - QoQ

QoQ Growth in quarter ended Mar 2026 is 21.63% vs -19.85% in Dec 2025
QoQ Growth in quarter ended Mar 2026 is 3,576.60% vs -41.98% in Dec 2025
Half Yearly Results Snapshot (Standalone) - Sep'25
Growth in half year ended Sep 2025 is 60.56% vs -5.57% in Sep 2024
Growth in half year ended Sep 2025 is 2,328.57% vs -97.21% in Sep 2024
Nine Monthly Results Snapshot (Standalone) - Dec'25
YoY Growth in nine months ended Dec 2025 is 47.59% vs 10.43% in Dec 2024
YoY Growth in nine months ended Dec 2025 is 703.70% vs -55.74% in Dec 2024
Annual Results Snapshot (Standalone) - Mar'26
YoY Growth in year ended Mar 2026 is 37.48% vs 15.97% in Mar 2025
YoY Growth in year ended Mar 2026 is 1,621.24% vs 197.37% in Mar 2025
About Shree Krishna Paper Mills & Industries Ltd

Company Coordinates


