
Compare Sh. Krishna Pap. with Similar Stocks
Dashboard
Weak Long Term Fundamental Strength with an average Return on Capital Employed (ROCE) of 8.01%
- Low ability to service debt as the company has a high Debt to EBITDA ratio of 2.97 times
Flat results in Mar 26
With ROCE of 10.1, it has a Expensive valuation with a 2.7 Enterprise value to Capital Employed
84.38% of Promoter Shares are Pledged
Stock DNA
Paper, Forest & Jute Products
INR 149 Cr (Micro Cap)
48.00
17
0.00%
0.84
8.67%
3.96
Total Returns (Price + Dividend) 
Sh. Krishna Pap. for the last several years.
Risk Adjusted Returns v/s
Returns Beta

News
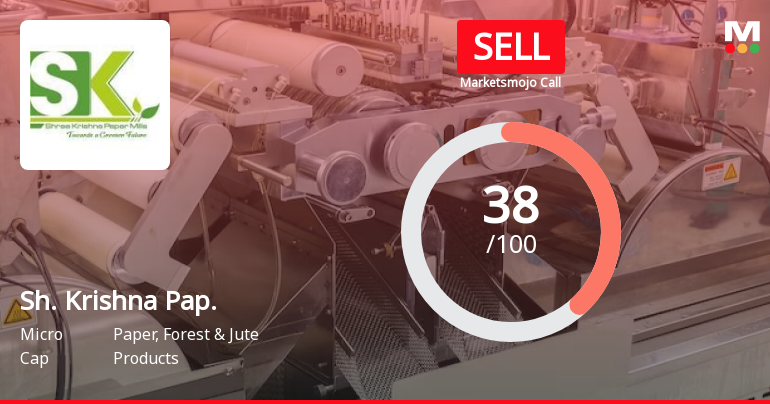
Shree Krishna Paper Mills & Industries Ltd is Rated Sell
Shree Krishna Paper Mills & Industries Ltd is rated Sell by MarketsMOJO. This rating was last updated on 29 May 2026. However, the analysis and financial metrics discussed below reflect the stock’s current position as of 18 July 2026, providing investors with the latest insights into the company’s fundamentals, valuation, financial trends, and technical outlook.
Read full news article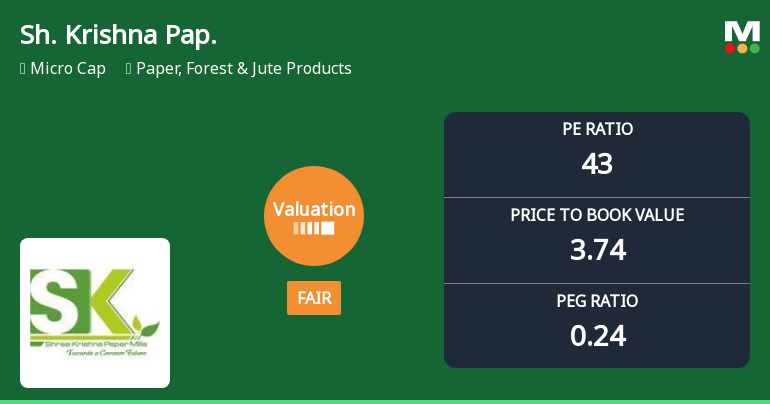
Shree Krishna Paper Mills & Industries Ltd: Valuation Shifts Signal Changing Price Attractiveness
Shree Krishna Paper Mills & Industries Ltd has witnessed a notable shift in its valuation parameters, moving from an expensive to a fair valuation grade. This change reflects evolving market perceptions amid fluctuating price-to-earnings and price-to-book ratios, prompting investors to reassess the stock’s price attractiveness within the Paper, Forest & Jute Products sector.
Read full news article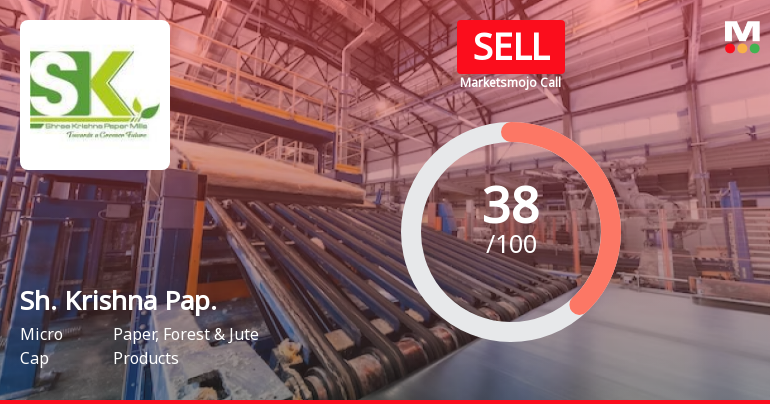
Shree Krishna Paper Mills & Industries Ltd is Rated Sell
Shree Krishna Paper Mills & Industries Ltd is rated 'Sell' by MarketsMOJO, with this rating last updated on 29 May 2026. However, the analysis and financial metrics presented here reflect the stock's current position as of 07 July 2026, providing investors with the latest insights into its performance and outlook.
Read full news article Announcements
Compliances-Certificate under Reg. 74 (5) of SEBI (DP) Regulations 2018
10-Jul-2026 | Source : BSECertificate under Regulation 74(5) of the SEBI (Depositories and Participants ) Regulations 2018 for the Quarter ended June 2026.
Announcement under Regulation 30 (LODR)-Newspaper Publication
08-Jul-2026 | Source : BSEintimation for special window for re-lodgement of transfer request of physical shares.
Closure of Trading Window
25-Jun-2026 | Source : BSEIntimation for Closure of Trading Window.
Corporate Actions

No Upcoming Board Meetings

No Dividend history available

No Splits history available

No Bonus history available

No Rights history available
Quality key factors
Valuation key factors
Technicals key factors
 Technical Indicator Scale: Bearish, Mildly Bearish, Sideways, Mildly Bullish, Bullish Turned
 Shareholding Snapshot : Jun 2026
Shareholding Compare (%holding)
Non Institution
84.3807
Held by 0 Schemes
Held by 0 FIIs
Bishwanath Industries Limited (15.14%)
Vijay Kumar Gupta (14.79%)
4.92%
Quarterly Results Snapshot (Standalone) - Mar'26 - QoQ

QoQ Growth in quarter ended Mar 2026 is 21.63% vs -19.85% in Dec 2025
QoQ Growth in quarter ended Mar 2026 is 3,576.60% vs -41.98% in Dec 2025
Half Yearly Results Snapshot (Standalone) - Sep'25
Growth in half year ended Sep 2025 is 60.56% vs -5.57% in Sep 2024
Growth in half year ended Sep 2025 is 2,328.57% vs -97.21% in Sep 2024
Nine Monthly Results Snapshot (Standalone) - Dec'25
YoY Growth in nine months ended Dec 2025 is 47.59% vs 10.43% in Dec 2024
YoY Growth in nine months ended Dec 2025 is 703.70% vs -55.74% in Dec 2024
Annual Results Snapshot (Standalone) - Mar'26
YoY Growth in year ended Mar 2026 is 37.48% vs 15.97% in Mar 2025
YoY Growth in year ended Mar 2026 is 1,621.24% vs 197.37% in Mar 2025
About Shree Krishna Paper Mills & Industries Ltd

Company Coordinates


