
Compare AGI Greenpac with Similar Stocks
Total Returns (Price + Dividend) 
Latest dividend: 7 per share ex-dividend date: Aug-22-2025
Risk Adjusted Returns v/s
Returns Beta

News
AGI Greenpac Q1 FY27: Strong Revenue Growth Offset by Profit Decline Amid Margin Pressures
AGI Greenpac Ltd., India's second-largest packaging company by market capitalisation, reported a mixed performance for the quarter ended June 2026, with robust revenue growth countered by a sequential decline in profitability. The company posted a net profit of ₹99.35 crores for Q1 FY27, representing a decline of 13.89% quarter-on-quarter but an improvement of 11.82% year-on-year. The stock responded positively to the results, surging 4.94% to ₹731.90 on July 29, 2026, as investors weighed the strong topline momentum against margin compression concerns.
Read full news article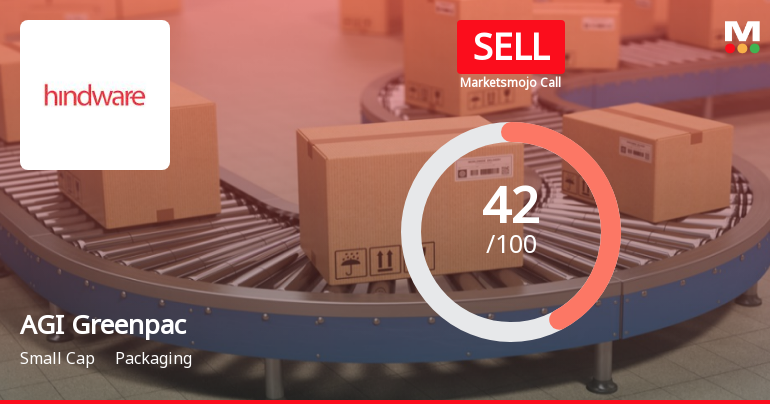
AGI Greenpac Ltd is Rated Sell by MarketsMOJO
AGI Greenpac Ltd is rated Sell by MarketsMOJO, with this rating last updated on 16 July 2026. However, the analysis and financial metrics discussed here reflect the company’s current position as of 28 July 2026, providing investors with the latest insights into the stock’s fundamentals, valuation, financial trends, and technical outlook.
Read full news article Announcements
Board Meeting Intimation for Board Meeting Intimation Pursuant To Regulation 29 Of SEBI (Listing Obligations And Disclosure Requirements) Regulations 2015
21-Jul-2026 | Source : BSEAgi Greenpac Ltdhas informed BSE that the meeting of the Board of Directors of the Company is scheduled on 28/07/2026 inter alia to consider and approve Pursuant to Regulation 29 of the SEBI (Listing Obligations and Disclosure Requirements) Regulations 2015 notice is hereby given that 337th meeting of the Board of Directors of the Company will be held on Tuesday 28th July 2026 for considering inter-alia the following matters: 1. Approval of Un-audited Standalone and Consolidated Financial Results together with Segment wise Revenue and Results Segment wise Assets and Liabilities for the first quarter ended 30th June 2026. 2. Other usual routine matters including any other matter brought before the Board with the kind consent of the Chairman.
Compliances-Certificate under Reg. 74 (5) of SEBI (DP) Regulations 2018
07-Jul-2026 | Source : BSECertificate under Regulation 74(5) of SEBI (DP) Regulations 2018 for the quarter ended 30.06.2026
Announcement under Regulation 30 (LODR)-Newspaper Publication
29-Jun-2026 | Source : BSENewspaper Publication regarding transfer of Equity shares to the IEPF Authority.
Corporate Actions

No Upcoming Board Meetings

AGI Greenpac Ltd has declared 350% dividend, ex-date: 22 Aug 25

No Splits history available

No Bonus history available

No Rights history available
Quality key factors
Valuation key factors
Technicals key factors
 Technical Indicator Scale: Bearish, Mildly Bearish, Sideways, Mildly Bullish, Bullish Turned
 Shareholding Snapshot : Jun 2026
Shareholding Compare (%holding)
Promoters
None
Held by 2 Schemes (0.31%)
Held by 66 FIIs (6.27%)
Somany Impresa Limited (50.84%)
Ashish Dhawan (4.79%)
24.89%
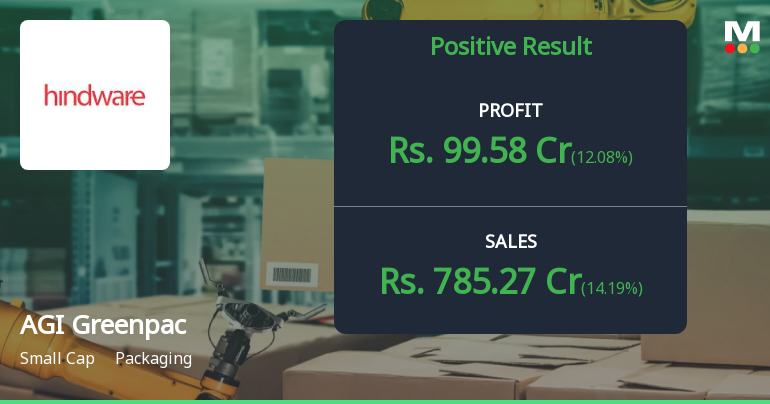
Quarterly Results Snapshot (Standalone) - Jun'26 - YoY

YoY Growth in quarter ended Jun 2026 is 14.19% vs 21.42% in Jun 2025
YoY Growth in quarter ended Jun 2026 is 12.08% vs 40.52% in Jun 2025
Half Yearly Results Snapshot (Standalone) - Sep'25

Growth in half year ended Sep 2025 is 10.62% vs -0.60% in Sep 2024
Growth in half year ended Sep 2025 is 21.92% vs 13.11% in Sep 2024
Nine Monthly Results Snapshot (Standalone) - Dec'25
YoY Growth in nine months ended Dec 2025 is 5.42% vs 1.60% in Dec 2024
YoY Growth in nine months ended Dec 2025 is 4.77% vs 20.93% in Dec 2024
Annual Results Snapshot (Consolidated) - Mar'26
Not Applicable: The company has declared_date for only one period
Not Applicable: The company has declared_date for only one period
About AGI Greenpac Ltd

Company Coordinates


