
Compare Cipla with Similar Stocks
Stock DNA
Pharmaceuticals & Biotechnology
INR 113,971 Cr (Large Cap)
27.00
34
0.96%
-0.24
11.87%
3.18
Total Returns (Price + Dividend) 
Latest dividend: 13.000000000000002 per share ex-dividend date: Jun-05-2026
Risk Adjusted Returns v/s
Returns Beta

News

Cipla Ltd Sees Sharp Open Interest Surge Amid Bullish Market Positioning
Cipla Ltd., a prominent player in the Pharmaceuticals & Biotechnology sector, witnessed a significant surge in open interest (OI) in its derivatives segment on 22 June 2026, signalling heightened market activity and shifting investor sentiment. The stock outperformed its sector peers and the broader Sensex, reflecting renewed optimism despite a recent downgrade in its Mojo Grade to Sell.
Read full news article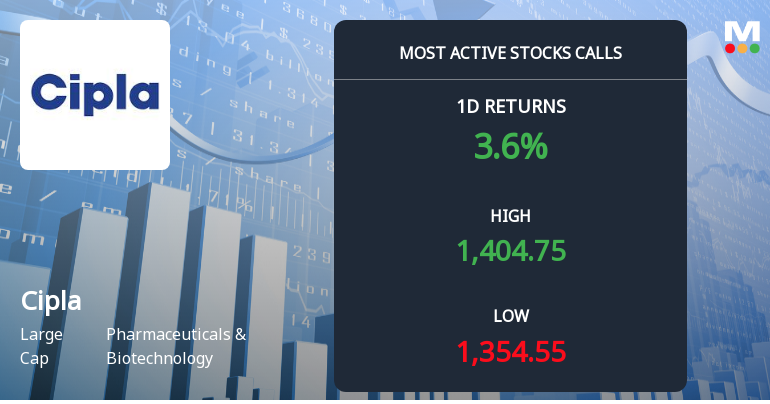
16,820 Call Contracts Traded on Cipla Ltd. as Stock Edges Above Rs 1,400 Strike
On 22 Jun 2026, Cipla Ltd. witnessed a surge in call option activity with 16,820 contracts traded at the Rs 1,400 strike price, closely aligned with the stock’s closing price of Rs 1,400.8. This synchrony between the derivatives and cash markets highlights a focused directional stance ahead of the 30 Jun 2026 expiry.
Read full news article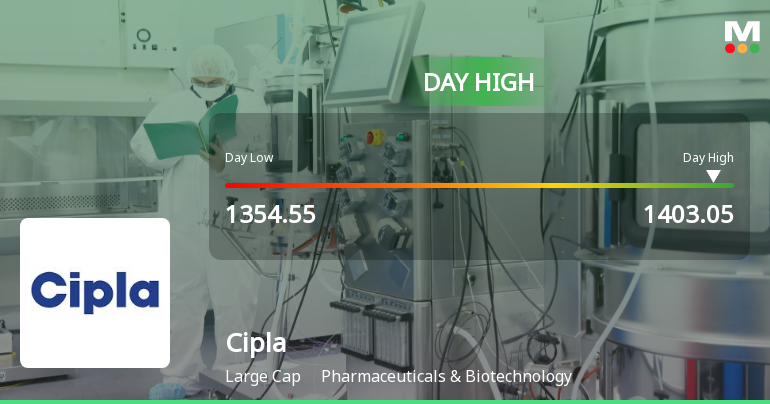
Cipla Ltd. Surges 3.43% to Day's High of Rs 1402.4 — Outperforms Sector by 3.29 Percentage Points
The Sensex advanced 0.57% on 22 Jun 2026, yet Cipla Ltd. outpaced the broader market with a 3.43% gain, touching an intraday high of Rs 1402.4. This 3.29 percentage-point outperformance over its Pharmaceuticals & Biotechnology sector peers signals a distinctly stock-specific rally rather than a market-wide lift.
Read full news article Announcements
Announcement under Regulation 30 (LODR)-Newspaper Publication
18-Jun-2026 | Source : BSENewspaper advertisement titled Notice to shareholders for transfer of shares to the Investor Education and Protection Fund
Announcement under Regulation 30 (LODR)-Change in Management
16-Jun-2026 | Source : BSEAppointment of Mr Shivam Puri as the CEO - One India Business and a member of the Management Council designated as a Senior Management Personnel of Company w.e.f 1st July 2026
Grant Of Stock Options And The Employee Stock Appreciation Rights
16-Jun-2026 | Source : BSEGrant of Stock Options and Employee Stock Appreciation Rights (ESARs)
Corporate Actions

No Upcoming Board Meetings

Cipla Ltd. has declared 650% dividend, ex-date: 05 Jun 26

No Splits history available

Cipla Ltd. has announced 3:2 bonus issue, ex-date: 24 Apr 06

No Rights history available
Quality key factors
Valuation key factors
Technicals key factors
 Technical Indicator Scale: Bearish, Mildly Bearish, Sideways, Mildly Bullish, Bullish Turned
 Shareholding Snapshot : Mar 2026
Shareholding Compare (%holding)
Promoters
None
Held by 42 Schemes (18.66%)
Held by 848 FIIs (22.56%)
Yusuf Khwaja Hameid (18.69%)
Lici New Endowment Plus- Secured Fund (9.62%)
13.98%
Quarterly Results Snapshot (Consolidated) - Mar'26 - QoQ

QoQ Growth in quarter ended Mar 2026 is -7.54% vs -6.79% in Dec 2025

QoQ Growth in quarter ended Mar 2026 is -17.93% vs -49.98% in Dec 2025
Half Yearly Results Snapshot (Consolidated) - Sep'25
Growth in half year ended Sep 2025 is 5.83% vs 5.67% in Sep 2024
Growth in half year ended Sep 2025 is 6.80% vs 16.63% in Sep 2024
Nine Monthly Results Snapshot (Consolidated) - Dec'25
YoY Growth in nine months ended Dec 2025 is 3.86% vs 6.16% in Dec 2024
YoY Growth in nine months ended Dec 2025 is -17.93% vs 27.28% in Dec 2024
Annual Results Snapshot (Consolidated) - Mar'26
YoY Growth in year ended Mar 2026 is 2.23% vs 6.88% in Mar 2025
YoY Growth in year ended Mar 2026 is -26.43% vs 27.93% in Mar 2025
About Cipla Ltd.

Company Coordinates


