
Compare Orient Ceratech with Similar Stocks
Dashboard
Strong ability to service debt as the company has a low Debt to EBITDA ratio of 0.93 times
Healthy long term growth as Operating profit has grown by an annual rate 48.55%
The company has declared Positive results for the last 3 consecutive quarters
With ROCE of 7.4, it has a Very Attractive valuation with a 1.5 Enterprise value to Capital Employed
Majority shareholders : Promoters
Market Beating Performance
Stock DNA
Electrodes & Refractories
INR 474 Cr (Micro Cap)
20.00
62
0.64%
0.10
7.77%
1.55
Total Returns (Price + Dividend) 
Latest dividend: 0.25 per share ex-dividend date: Sep-16-2025
Risk Adjusted Returns v/s
Returns Beta

News
Orient Ceratech Ltd Downgraded to Hold Amid Mixed Technical and Valuation Signals
Orient Ceratech Ltd, a micro-cap player in the Electrodes & Refractories sector, has seen its investment rating downgraded from Buy to Hold as of 23 June 2026. This adjustment reflects a nuanced reassessment across four key parameters: quality, valuation, financial trend, and technical indicators. While the company continues to demonstrate solid financial performance and attractive valuation metrics, evolving technical signals and a cautious outlook on momentum have prompted a more measured stance.
Read full news article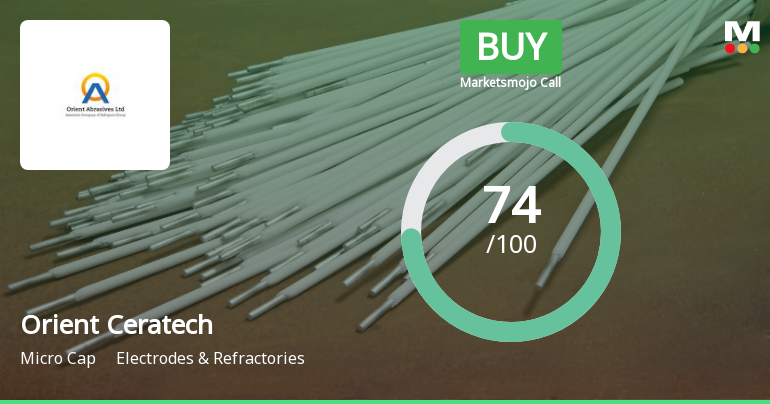
Orient Ceratech Ltd Upgraded to Buy on Strong Financials and Bullish Technicals
Orient Ceratech Ltd has been upgraded from a Hold to a Buy rating, reflecting significant improvements across quality, valuation, financial trends, and technical indicators. The micro-cap player in the Electrodes & Refractories sector has demonstrated robust financial performance and a bullish technical outlook, prompting MarketsMOJO to raise its Mojo Grade to 74.0.
Read full news article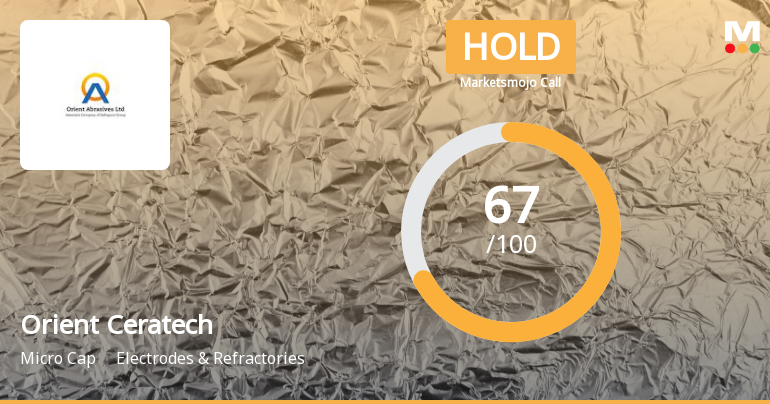
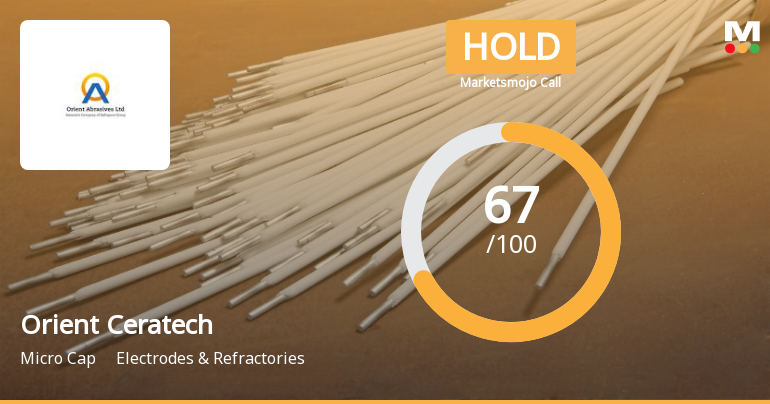
Orient Ceratech Ltd is Rated Hold by MarketsMOJO
Orient Ceratech Ltd is rated 'Hold' by MarketsMOJO, with this rating last updated on 29 May 2026. However, the analysis and financial metrics discussed here reflect the company’s current position as of 10 June 2026, providing investors with the latest insights into its performance and outlook.
Read full news article Announcements
Intimation Under Regulation 30 Of The SEBI (Listing Obligations And Disclosure Requirements) Regulations 2015
18-Jun-2026 | Source : BSEEnclosed
Intimation Under Regulation 30 Of The SEBI (Listing Obligations And Disclosure Requirements) Regulations 2015
09-Jun-2026 | Source : BSEEnclosed
Announcement under Regulation 30 (LODR)-Newspaper Publication
29-May-2026 | Source : BSEEnclosed
Corporate Actions

No Upcoming Board Meetings

Orient Ceratech Ltd has declared 25% dividend, ex-date: 16 Sep 25

No Splits history available

Orient Ceratech Ltd has announced 1:1 bonus issue, ex-date: 12 Aug 09

No Rights history available
Quality key factors
Valuation key factors
Technicals key factors
 Technical Indicator Scale: Bearish, Mildly Bearish, Sideways, Mildly Bullish, Bullish Turned
 Shareholding Snapshot : Mar 2026
Shareholding Compare (%holding)
Promoters
None
Held by 0 Schemes
Held by 6 FIIs (13.32%)
Cura Global Holdings Limited (23.73%)
Legends Global Opportunities (singapore) Pte. Ltd. (8.75%)
17.19%
Quarterly Results Snapshot (Consolidated) - Mar'26 - QoQ

QoQ Growth in quarter ended Mar 2026 is 5.24% vs -17.79% in Dec 2025
QoQ Growth in quarter ended Mar 2026 is 28.34% vs -41.12% in Dec 2025
Half Yearly Results Snapshot (Consolidated) - Sep'25
Growth in half year ended Sep 2025 is 26.11% vs 7.97% in Sep 2024
Growth in half year ended Sep 2025 is 147.69% vs -49.74% in Sep 2024
Nine Monthly Results Snapshot (Consolidated) - Dec'25
YoY Growth in nine months ended Dec 2025 is 26.06% vs 4.97% in Dec 2024
YoY Growth in nine months ended Dec 2025 is 150.77% vs -56.11% in Dec 2024
Annual Results Snapshot (Consolidated) - Mar'26
YoY Growth in year ended Mar 2026 is 23.39% vs 4.38% in Mar 2025
YoY Growth in year ended Mar 2026 is 120.14% vs -47.79% in Mar 2025
About Orient Ceratech Ltd

Company Coordinates


