
Compare Orient Ceratech with Similar Stocks
Dashboard
Strong ability to service debt as the company has a low Debt to EBITDA ratio of 0.93 times
Healthy long term growth as Operating profit has grown by an annual rate 48.55%
The company has declared Positive results for the last 3 consecutive quarters
With ROCE of 7.4, it has a Very Attractive valuation with a 1.6 Enterprise value to Capital Employed
Despite the size of the company, domestic mutual funds hold only 0% of the company
Below par performance in long term as well as near term
Stock DNA
Electrodes & Refractories
INR 502 Cr (Micro Cap)
21.00
64
0.60%
0.10
7.77%
1.66
Total Returns (Price + Dividend) 
Latest dividend: 0.25 per share ex-dividend date: Sep-16-2025
Risk Adjusted Returns v/s
Returns Beta

News
Orient Ceratech Ltd is Rated Hold by MarketsMOJO
Orient Ceratech Ltd is rated Hold by MarketsMOJO. This rating was last updated on 23 June 2026. However, the analysis and financial metrics discussed below reflect the company’s current position as of 16 July 2026, providing investors with the latest insights into the stock’s fundamentals, valuation, financial trends, and technical outlook.
Read full news article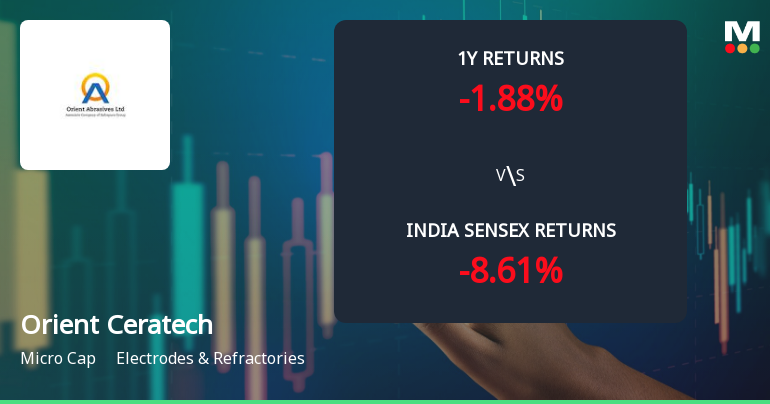
Orient Ceratech Ltd Technical Momentum Shifts to Mildly Bullish Amid Market Volatility
Orient Ceratech Ltd, a micro-cap player in the Electrodes & Refractories sector, has exhibited a notable shift in its technical momentum from mildly bearish to mildly bullish. Despite a mixed performance relative to the broader Sensex index, recent technical indicators suggest a cautiously optimistic outlook for the stock, which closed at ₹41.70 on 9 Jul 2026, up 3.06% from the previous close of ₹40.46.
Read full news article
Orient Ceratech Ltd is Rated Hold by MarketsMOJO
Orient Ceratech Ltd is rated Hold by MarketsMOJO, with this rating last updated on 23 June 2026. However, the analysis and financial metrics discussed here reflect the company’s current position as of 05 July 2026, providing investors with the latest insights into its performance and outlook.
Read full news article Announcements
Compliances-Certificate under Reg. 74 (5) of SEBI (DP) Regulations 2018
13-Jul-2026 | Source : BSECertificate under reg. 74(5) of SEBI (DP) Regulations 2018 for the quarter ended 30th June 2026.
Announcement under Regulation 30 (LODR)-Credit Rating
02-Jul-2026 | Source : BSEUpdate on Credit Rating
Announcement under Regulation 30 (LODR)-Newspaper Publication
01-Jul-2026 | Source : BSECopy of Newspaper Advertisement of Postal Ballot
Corporate Actions

No Upcoming Board Meetings

Orient Ceratech Ltd has declared 25% dividend, ex-date: 16 Sep 25

No Splits history available

Orient Ceratech Ltd has announced 1:1 bonus issue, ex-date: 12 Aug 09

No Rights history available
Quality key factors
Valuation key factors
Technicals key factors
 Technical Indicator Scale: Bearish, Mildly Bearish, Sideways, Mildly Bullish, Bullish Turned
 Shareholding Snapshot : Mar 2026
Shareholding Compare (%holding)
Promoters
None
Held by 0 Schemes
Held by 6 FIIs (13.32%)
Cura Global Holdings Limited (23.73%)
Legends Global Opportunities (singapore) Pte. Ltd. (8.75%)
17.19%
Quarterly Results Snapshot (Consolidated) - Mar'26 - QoQ

QoQ Growth in quarter ended Mar 2026 is 5.24% vs -17.79% in Dec 2025
QoQ Growth in quarter ended Mar 2026 is 28.34% vs -41.12% in Dec 2025
Half Yearly Results Snapshot (Consolidated) - Sep'25
Growth in half year ended Sep 2025 is 26.11% vs 7.97% in Sep 2024
Growth in half year ended Sep 2025 is 147.69% vs -49.74% in Sep 2024
Nine Monthly Results Snapshot (Consolidated) - Dec'25
YoY Growth in nine months ended Dec 2025 is 26.06% vs 4.97% in Dec 2024
YoY Growth in nine months ended Dec 2025 is 150.77% vs -56.11% in Dec 2024
Annual Results Snapshot (Consolidated) - Mar'26
YoY Growth in year ended Mar 2026 is 23.39% vs 4.38% in Mar 2025
YoY Growth in year ended Mar 2026 is 120.14% vs -47.79% in Mar 2025
About Orient Ceratech Ltd

Company Coordinates


