
Compare Kanoria Chem. with Similar Stocks
Dashboard
Weak Long Term Fundamental Strength with a -2.16% CAGR growth in Net Sales over the last 5 years
- Low ability to service debt as the company has a high Debt to EBITDA ratio of 4.08 times
- The company has been able to generate a Return on Equity (avg) of 1.62% signifying low profitability per unit of shareholders funds
The company has declared Positive results for the last 3 consecutive quarters
With ROCE of 4.3, it has a Very Attractive valuation with a 0.9 Enterprise value to Capital Employed
29.57% of Promoter Shares are Pledged
Stock DNA
Commodity Chemicals
INR 510 Cr (Micro Cap)
12.00
43
0.00%
0.48
6.97%
0.85
Total Returns (Price + Dividend) 
Latest dividend: 1 per share ex-dividend date: Aug-24-2022
Risk Adjusted Returns v/s
Returns Beta

News

Kanoria Chemicals & Industries Ltd Locks at Upper Circuit With 5% Gain — Buyers Queue, Sellers Absent
At Rs 120.72, the buying was done — not because demand dried up, but because the exchange wouldn't let the stock go any higher. Kanoria Chemicals & Industries Ltd locked at its upper circuit of 5% on 19 Jun 2026, with buyers queuing and no sellers willing to part with shares.
Read full news article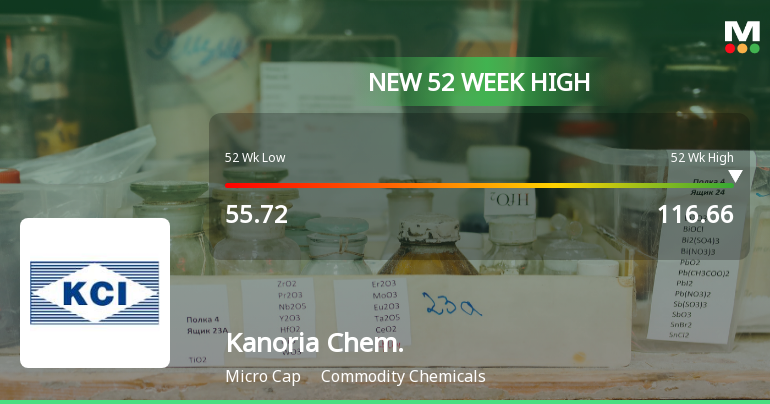
Broad-Based Technical Strength Lifts Kanoria Chemicals & Industries Ltd to 52-Week High of Rs 116.66
Surging to a fresh 52-week high of Rs 116.66 on 19 Jun 2026, Kanoria Chemicals & Industries Ltd has demonstrated robust price momentum, outperforming its sector by 4.77% today and extending a three-day winning streak that has delivered a 15.75% gain. This rally comes amid a broader market backdrop where the Sensex trades lower, underscoring the stock’s distinctive strength.
Read full news article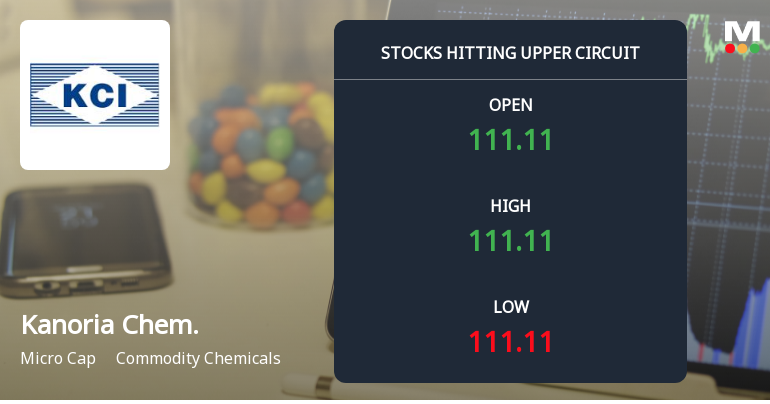
Kanoria Chemicals & Industries Ltd Locks at Upper Circuit With 5% Gain — Buyers Queue, Sellers Absent
At Rs 114.98, the buying was done — not because demand dried up, but because the exchange wouldn't let the stock go any higher. Kanoria Chemicals & Industries Ltd locked at its upper circuit of 5% on 18 Jun 2026, with buyers queuing and no sellers willing to part with shares.
Read full news article Announcements
Compliances-Reg.24(A)-Annual Secretarial Compliance
29-May-2026 | Source : BSEAnnual Secretarial Compliance Report for the year ended 31st March 2026.
Announcement under Regulation 30 (LODR)-Newspaper Publication
26-May-2026 | Source : BSENewspaper publication
Announcement under Regulation 30 (LODR)-Change in Management
25-May-2026 | Source : BSEIntimation under Regulation 30
Corporate Actions

No Upcoming Board Meetings

Kanoria Chemicals & Industries Ltd has declared 20% dividend, ex-date: 24 Aug 22

Kanoria Chemicals & Industries Ltd has announced 5:10 stock split, ex-date: 31 Dec 07

Kanoria Chemicals & Industries Ltd has announced 1:2 bonus issue, ex-date: 31 Dec 07

No Rights history available
Quality key factors
Valuation key factors
Technicals key factors
 Technical Indicator Scale: Bearish, Mildly Bearish, Sideways, Mildly Bullish, Bullish Turned
 Shareholding Snapshot : Mar 2026
Shareholding Compare (%holding)
Promoters
29.5708
Held by 4 Schemes (0.07%)
Held by 3 FIIs (0.04%)
Vardhan Limited (59.94%)
Sanjiv Dhireshbhai Shah (2.79%)
21.03%
Quarterly Results Snapshot (Consolidated) - Mar'26 - QoQ

QoQ Growth in quarter ended Mar 2026 is 14.51% vs 26.68% in Dec 2025

QoQ Growth in quarter ended Mar 2026 is 790.70% vs -96.20% in Dec 2025
Half Yearly Results Snapshot (Consolidated) - Sep'25
Growth in half year ended Sep 2025 is 14.20% vs -53.41% in Sep 2024
Growth in half year ended Sep 2025 is 380.23% vs -45.41% in Sep 2024
Nine Monthly Results Snapshot (Consolidated) - Dec'25
YoY Growth in nine months ended Dec 2025 is 25.28% vs -51.52% in Dec 2024
YoY Growth in nine months ended Dec 2025 is 288.82% vs -62.05% in Dec 2024
Annual Results Snapshot (Consolidated) - Mar'26
YoY Growth in year ended Mar 2026 is 30.11% vs -48.86% in Mar 2025
YoY Growth in year ended Mar 2026 is 244.47% vs -117.71% in Mar 2025
About Kanoria Chemicals & Industries Ltd

Company Coordinates


