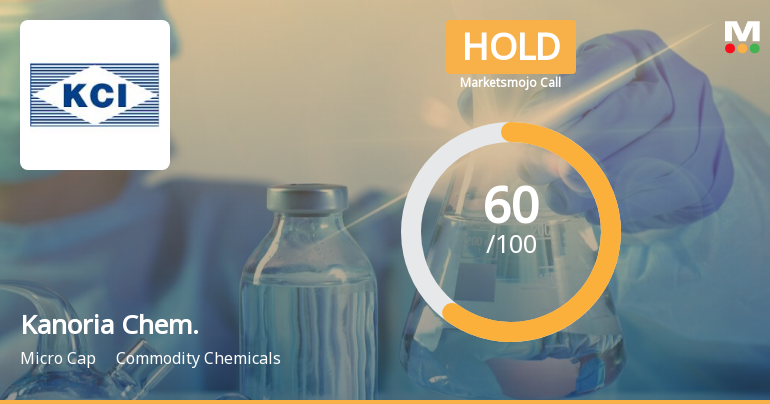
Kanoria Chem.

  • Market Cap: Micro Cap
  • Industry: Commodity Chemicals
  • ISIN: INE138C01024
  • NSEID: KANORICHEM
  • BSEID: 506525
INR
156.60
-1.75 (-1.11%)
BSENSE

Sep 01, 03:30 PM

BSE+NSE Vol: 17.84 k

  • Price Points
  • Score
  • Mojo Parameters
  • Total Return
  • News and Corporate Actions
  • Key factors
  • Shareholding
  • Financials
  • CompanyCV
stock-summaryPrice Point
High/Low

1Day

52 Week

Valuation
Technical
Day's Volume

CASH

17.84 k (-23.82%) Volume

Shareholding (Jun 2026)

FII

0.05%

Held by 3 FIIs

DII

0.08%

Held by 0 DIIs

Promoter

74.40%

Why is Kanoria Chemicals & Industries Ltd falling/rising?

01-Sep-2026

As of 31-Aug, the stock price of Kanoria Chemicals & Industries Ltd is at 158.35, down 0.57%. Despite a recent decline, the stock has shown strong performance with significant gains over the past weeks and months, indicating positive investor sentiment.

As of 31-Aug, the stock price of Kanoria Chemicals & Industries Ltd is currently at 158.35, reflecting a decrease of 0.9 (-0.57%). Despite this decline, the stock has shown strong performance over various periods. Over the past week, it has increased by 1.70%, and in the last month, it has risen by 12.15%. Year-to-date, the stock has surged by 106.62%, significantly outperforming the Sensex, which has declined by 9.70% during the same period.<BR><BR>Today, the stock has outperformed its sector by 0.92% and has been on a gaining streak for the last three days, accumulating a total return of 2.31% in that timeframe. Additionally, it is trading above its moving averages across multiple timeframes, including the 5-day, 20-day, 50-day, 100-day, and 200-day averages, indicating a generally positive trend.<BR><BR>However, there are some concerns regarding investor participation, as the delivery volume has fallen by 80.61% compared to the 5-day average, which may suggest a decrease in trading activity. Despite this drop in volume, the stock remains liquid enough for trading, based on its average traded value.<BR><BR>In summary, while the stock is currently experiencing a slight decline, its overall performance remains strong, with significant gains over the past weeks and months, indicating a generally positive sentiment among investors despite the recent dip.

View full answer

Who are in the management team of Kanoria Chem.?

01-Sep-2026

The management team of Kanoria Chem. includes R V Kanoria (Chairman & Managing Director), H K Khaitan, A Vellayan, Amitav Kothari, Sidharth Kumar Birla, and Suhana Murshad (all Independent Directors), along with Madhuvanti Kanoria (Non-Executive Director), S V Kanoria (Whole-time Director), and Neha Saraf (Company Secretary & Compliance Officer). This team offers a diverse range of expertise and leadership.

The management team of Kanoria Chem. includes the following individuals:<BR><BR>1. R V Kanoria - Chairman & Managing Director<BR>2. H K Khaitan - Independent Director<BR>3. A Vellayan - Independent Director<BR>4. Amitav Kothari - Independent Director<BR>5. Madhuvanti Kanoria - Non-Executive Director<BR>6. S V Kanoria - Whole-time Director<BR>7. Sidharth Kumar Birla - Independent Director<BR>8. Suhana Murshad - Independent Director<BR>9. Neha Saraf - Company Secretary & Compliance Officer<BR><BR>This team brings a diverse range of expertise and leadership to the company.

View full answer

What does Kanoria Chem. do?

01-Sep-2026

Kanoria Chemicals & Industries Ltd is an Indian micro-cap company specializing in aloc and chloro chemicals, with recent net sales of ₹460 Cr and a net profit of ₹26 Cr as of June 2026. The company has a market cap of ₹682 Cr and key financial metrics include a P/E ratio of 11.00 and a debt-equity ratio of 0.48.

Overview: <BR>Kanoria Chemicals & Industries Ltd is a leading chemical manufacturing company in India, specializing in the production of aloc chemicals and chloro chemicals within the commodity chemicals industry and categorized as a micro-cap company.<BR><BR>History: <BR>Incorporated in December 1960, Kanoria Chemicals & Industries Ltd has established itself in the chemical manufacturing sector. The latest quarterly results reported net sales and net profit for June 2026.<BR><BR>Financial Snapshot: <BR>Most recent Net Sales: 460 Cr (Quarterly Results - Jun 2026) <BR>Most recent Net Profit: 26 Cr (Quarterly Results - Jun 2026) <BR>Market-cap value: INR 682 Cr (Micro Cap)<BR><BR>Key Metrics: <BR>P/E: 11.00 <BR>Industry P/E: 43 <BR>Dividend Yield: 0.00% <BR>Debt-Equity: 0.48 <BR>Return on Equity: 6.97% <BR>Price to Book: 1.22 <BR><BR>Contact Details: <BR>Address: KCI Plaza 6th Floor, 23 Ashutosh Chowdhury Avenue Kolkata West Bengal : 700019 <BR>Tel: +91-33-40313200 <BR>Email: info@kanoriachem.com <BR>Website: http://www.kanoriachem.com

View full answer

Who are the peers of the Kanoria Chem.?

01-Sep-2026

Kanoria Chem.'s peers include Sadhana Nitro, Sr.Rayala.Hypo, OCCL, and others, with varying management and growth risks. Kanoria Chem. leads with a 1-year return of 90.55%, significantly outperforming its peers.

Peers: The peers of Kanoria Chem. are Sadhana Nitro, Sr.Rayala.Hypo, OCCL, Transpek Inds., Tuticorin Alkali, Chemfab Alka., Blue Pearl Agri, Primo Chemicals, and POCL Enterprises.<BR><BR>Quality Snapshot: Excellent management risk is observed at Sr.Rayala.Hypo and Transpek Inds., while Average management risk is found at OCCL, Tuticorin Alkali, Chemfab Alka., Blue Pearl Agri, Primo Chemicals, and POCL Enterprises, and the rest. Below Average management risk is present at Sadhana Nitro and Kanoria Chem. In terms of Growth, Excellent growth is noted at OCCL and POCL Enterprises, Good growth at Tuticorin Alkali, Average growth at Blue Pearl Agri, while Below Average growth is seen at Sadhana Nitro, Sr.Rayala.Hypo, Transpek Inds., Kanoria Chem., Chemfab Alka., and Primo Chemicals, and the rest. For Capital Structure, Excellent capital structure is found at Sr.Rayala.Hypo, OCCL, Transpek Inds., and Tuticorin Alkali, Good capital structure at Blue Pearl Agri, while Below Average capital structure is observed at Sadhana Nitro, Kanoria Chem., and POCL Enterprises, and the rest.<BR><BR>Return Snapshot: The peer with the highest 1-year return is Kanoria Chem. at 90.55%, while the peer with the lowest is Blue Pearl Agri at -92.33%. Kanoria Chem.'s 1-year return significantly outperforms all peers. Additionally, Chemfab Alka., Blue Pearl Agri, and POCL Enterprises have negative six-month returns.

View full answer

How big is Kanoria Chem.?

01-Sep-2026

As of 31st August, Kanoria Chemicals & Industries Ltd has a market capitalization of 682.00 Cr, with recent net sales of 1240.42 Cr and a net profit of 154.97 Cr. Shareholder's funds are 572.91 Cr, and total assets amount to 1,117.04 Cr.

As of 31st August, Kanoria Chemicals & Industries Ltd has a market capitalization of 682.00 Cr, categorizing it as a Micro Cap company.<BR><BR>In the latest four quarters, the company reported Net Sales of 1240.42 Cr and a Net Profit of 154.97 Cr.<BR><BR>For the latest annual period ending in March 2026, Shareholder's Funds amounted to 572.91 Cr, while Total Assets were reported at 1,117.04 Cr.

View full answer

Should I buy, sell or hold Kanoria Chemicals & Industries Ltd?

13-Aug-2026

When is the next results date for Kanoria Chemicals & Industries Ltd?

05-Aug-2026

The next results date for Kanoria Chemicals & Industries Ltd is 11 August 2026.

The next results date for Kanoria Chemicals & Industries Ltd is scheduled for 11 August 2026.

View full answer

Are Kanoria Chemicals & Industries Ltd latest results good or bad?

26-May-2026

Kanoria Chemicals & Industries Ltd's latest results show a significant profit increase due to a tax reversal, but revenue declined year-on-year, and the company faces ongoing financial challenges, including high leverage and low returns. Overall, while there are some positive trends, the results indicate underlying operational weaknesses, warranting cautious investor sentiment.

Kanoria Chemicals & Industries Ltd's latest results present a mixed picture. On one hand, the company reported a significant net profit of ₹31.62 crore for Q4 FY26, reflecting a remarkable 790.70% increase quarter-on-quarter. This surge in profit, however, is largely attributed to a tax reversal rather than a genuine operational improvement, as the company had previously recorded losses in the earlier quarters of FY26.<BR><BR>Revenue for the same quarter was ₹304.39 crore, which is a 14.51% increase from the previous quarter, but it represents a substantial 29.44% decline compared to the same period last year. The operating margin improved to 8.90%, the highest in seven quarters, indicating some progress in cost management.<BR><BR>Despite these positive signs, the overall financial health of the company raises concerns. The year-on-year decline in both revenue and profit highlights ongoing challenges in the commodity chemicals sector, where Kanoria has struggled with consistent profitability. The company also reported a net loss of ₹109 crore for FY25, and its return on capital employed (ROCE) and return on equity (ROE) remain alarmingly low at 1.75% and 1.49%, respectively.<BR><BR>Furthermore, the company's high leverage, with a debt-to-EBITDA ratio of 8.98 times, poses significant financial risks. The reliance on non-operating income to boost profits further complicates the outlook.<BR><BR>In summary, while the latest quarterly results show some positive trends, the underlying operational weaknesses and financial challenges suggest that the results are not entirely good. Investors should approach with caution, considering the potential for volatility and the need for sustainable improvements in performance.

View full answer

How has been the historical performance of Kanoria Chem.?

12-Nov-2025

Kanoria Chem. has faced significant financial declines, with net sales dropping from 1,578.43 Cr in Mar'23 to 754.31 Cr in Mar'25, and profit before tax turning negative from -12.21 Cr to -43.05 Cr during the same period, indicating ongoing financial challenges. Total assets and liabilities increased slightly, while cash flow from operating activities decreased.

Answer:<BR>The historical performance of Kanoria Chem. shows significant fluctuations in key financial metrics over the years.<BR><BR>Breakdown:<BR>Kanoria Chem. experienced a decline in net sales from 1,578.43 Cr in Mar'23 to 754.31 Cr in Mar'25, reflecting a downward trend in total operating income as well, which fell from 1,578.43 Cr to 754.31 Cr during the same period. The company's total expenditure also decreased from 1,506.07 Cr in Mar'23 to 721.68 Cr in Mar'25. Operating profit (PBDIT) saw a decline from 82.69 Cr in Mar'23 to 49.36 Cr in Mar'25, while profit before tax turned negative, dropping from -12.21 Cr in Mar'23 to -43.05 Cr in Mar'25. Consequently, profit after tax also worsened, moving from -12.88 Cr in Mar'23 to -54.49 Cr in Mar'25. The company's total assets increased slightly from 1,481.43 Cr in Mar'23 to 1,498.28 Cr in Mar'25, while total liabilities rose from 1,481.43 Cr to 1,498.28 Cr. Cash flow from operating activities decreased from 25.00 Cr in Mar'23 to 14.00 Cr in Mar'25, and the net cash outflow was recorded at -3.00 Cr in Mar'25, indicating ongoing financial challenges.

View full answer

Is Kanoria Chem. overvalued or undervalued?

09-Jun-2025

As of August 9, 2023, Kanoria Chemicals is considered overvalued and risky, with a negative PE ratio of -7.52 and a significant year-to-date decline of -16.96%, contrasting sharply with its peers and the Sensex's positive performance.

As of 9 August 2023, the valuation grade for Kanoria Chemicals has moved from attractive to risky, indicating a significant shift in the company's perceived value. The company appears to be overvalued based on its current financial metrics, with a PE ratio of -7.52, an EV to EBITDA ratio of 31.83, and a Price to Book Value of 0.80. These ratios suggest that the company's earnings are not only negative but also that its valuation is not justified by its operational performance.<BR><BR>In comparison to its peers, Kanoria Chemicals' valuation stands out as particularly unfavorable. For instance, Solar Industries has a PE ratio of 123.77, while Godrej Industries shows a PE of 46.63, both indicating a more robust market position. The significant negative returns for Kanoria Chemicals, particularly a YTD decline of -16.96% compared to the Sensex's 5.63% gain, further reinforces the notion that the company is currently overvalued.

View full answer

What is the technical trend for Kanoria Chem.?

09-Jun-2025

As of April 17, 2025, Kanoria Chem. shows a mildly bearish trend overall, with mixed signals across different time frames, including a mildly bullish weekly MACD and a bearish monthly MACD.

As of 17 April 2025, the technical trend for Kanoria Chem. has changed from bearish to mildly bearish. The weekly MACD indicates a mildly bullish stance, while the monthly MACD remains bearish. The daily moving averages show a mildly bearish trend, and the Bollinger Bands on a weekly basis are bullish but mildly bearish on a monthly basis. The KST is mildly bullish weekly but bearish monthly, and the Dow Theory shows a mildly bullish trend on the weekly chart with no trend on the monthly. The OBV is mildly bullish for both weekly and monthly periods. Overall, the current technical stance is mildly bearish, reflecting mixed signals across different time frames.

View full answer

Who are the top shareholders of the Kanoria Chem.?

06-Jun-2025

The top shareholders of Kanoria Chemicals are Vardhan Limited, holding 59.94%, followed by individual investors with 20.53%. Other shareholders include mutual funds (0.07%), foreign institutional investors (0.06%), and the highest public shareholder, Sanjiv Dhireshbhai Shah, with 2.73%.

The top shareholders of Kanoria Chemicals include the promoters, who hold a significant majority of the shares. The promoter with the highest holding is Vardhan Limited, which owns 59.94% of the company. Additionally, individual investors collectively hold 20.53% of the shares. Other notable shareholders include mutual funds, which hold a small portion (0.07%) across four schemes, and foreign institutional investors (FIIs), who hold 0.06% through six different entities. The highest public shareholder is Sanjiv Dhireshbhai Shah, with a holding of 2.73%.

View full answer

What is the bonus history of the Kanoria Chem.?

06-Jun-2025

Kanoria Chemicals & Industries Ltd issued a 1:2 bonus on December 31, 2007, with a record date of January 7, 2008, meaning shareholders received one additional share for every two shares held.

Kanoria Chemicals & Industries Ltd has a bonus history that includes a 1:2 bonus issue announced with an ex-date of December 31, 2007. The record date for this bonus was January 7, 2008. This means that for every two shares held, shareholders received one additional share as a bonus.

View full answer

Has Kanoria Chem. declared dividend?

06-Jun-2025

Yes, Kanoria Chemicals & Industries Ltd has declared a 20% dividend, amounting to ₹1 per share, with an ex-date of August 24, 2022. Despite this, the company has experienced negative total returns over shorter periods, although it showed significant recovery in the 5-year period.

Kanoria Chemicals & Industries Ltd has declared a 20% dividend.<BR><BR>Dividend Details:<BR>- Percentage announced: 20%<BR>- Amount per share: 1 per share<BR>- Ex-date: 24 Aug 22<BR><BR>Dividend Yield: 0%<BR><BR>Total Returns by Period:<BR>In the 6-month period, the price return was -20.54%, the dividend return was 0%, resulting in a total return of -20.54%.<BR><BR>For the 1-year period, the price return was -14.72%, the dividend return was 0%, leading to a total return of -14.72%.<BR><BR>Over the 2-year period, the price return was -18.91%, with a dividend return of 0%, culminating in a total return of -18.91%.<BR><BR>In the 3-year period, the price return was -22.86%, the dividend return was 0.93%, resulting in a total return of -21.93%.<BR><BR>For the 4-year period, the price return was -25.46%, with a dividend return of 0.69%, leading to a total return of -24.77%.<BR><BR>In the 5-year period, the price return was 174.57%, the dividend return was 2.96%, resulting in a total return of 177.53%.<BR><BR>Overall, while Kanoria Chemicals & Industries Ltd declared a dividend, the total returns over the various periods indicate a challenging performance, particularly in the shorter terms, with significant losses in price returns. However, the 5-year period shows a substantial recovery in total returns, primarily driven by price appreciation.

View full answer
iScoreScore
Click here to find our call on this stock
Strong Sell
Sell
Hold
Buy
Strong Buy

Dashboard

1

Weak Long Term Fundamental Strength with a -0.77% CAGR growth in Net Sales over the last 5 years

  • Low ability to service debt as the company has a high Debt to EBITDA ratio of 4.08 times
  • The company has been able to generate a Return on Equity (avg) of 1.62% signifying low profitability per unit of shareholders funds
2

With a growth in Net Sales of 51.24%, the company declared Very Positive results in Jun 26

3

With ROCE of 4.3, it has a Fair valuation with a 1.1 Enterprise value to Capital Employed

4

29.57% of Promoter Shares are Pledged

stock-summaryMojo Parameters

Mojo Parameters

Loading Valuation Snapshot...

Stock DNA

stock-summary
Industry

Commodity Chemicals

stock-summary
Market cap

INR 701 Cr (Micro Cap)

stock-summary
P/E

11.00

stock-summary
Industry P/E

43

stock-summary
Dividend Yield

0.00%

stock-summary
Debt Equity

0.48

stock-summary
Return on Equity

6.97%

stock-summary
Price to Book

1.22

Revenue and Profits:
Net Sales:
460 Cr
(Quarterly Results - Jun 2026)
Net Profit:
26 Cr
stock-summaryTotal Returns
Total Returns (Price + Dividend) stock-summary
Dividend Yield (0%)
TimePeriod
Price Return
Dividend Return
Total Return
3 Months
66.12%
0%
66.12%
6 Months
129.92%
0%
129.92%
1 Year
86.1%
0%
86.1%
2 Years
25.23%
0%
25.23%
3 Years
28.36%
0%
28.36%
4 Years
-1.29%
0%
-1.29%
5 Years
2.69%
0.53%
3.22%

Latest dividend: 1 per share ex-dividend date: Aug-24-2022

Risk Adjusted Returns v/s stock-summary
Returns Beta
Icon
Beta has not been calculated since enough price history is not available
stock-summaryNews & Corporate Actions

News

Kanoria Chemicals Gains 1.69%: Key Financials and 52-Week High Drive Momentum

Announcements stock-summary

Announcement under Regulation 30 (LODR)-Newspaper Publication

12-Aug-2026 | Source : BSE

News Paper publication of Statement of Unaudited Financial Results (Standalone & Consolidated) for the quarter ended 30th June 2026

Unaudited Financial Result For Quarter Ended 30Th June 2026

11-Aug-2026 | Source : BSE

Unaudited Financial Result for quarter ended 30th June 2026

Board Meeting Outcome for Outcome Of The Board Meeting

11-Aug-2026 | Source : BSE

This is to inform that the Board of Directors of the Company at its Meeting held today i.e. 11th August 2026 considered and approved the Unaudited Financial Results (Standalone and Consolidated) of the Company for the quarter ended 30th June 2026 along with the Limited Review Reports.

Corporate Actions stock-summary

stock-summary
BOARD MEETING

No Upcoming Board Meetings

stock-summary
DIVIDEND

Kanoria Chemicals & Industries Ltd has declared 20% dividend, ex-date: 24 Aug 22

stock-summary
SPLITS

Kanoria Chemicals & Industries Ltd has announced 5:10 stock split, ex-date: 31 Dec 07

stock-summary
BONUS

Kanoria Chemicals & Industries Ltd has announced 1:2 bonus issue, ex-date: 31 Dec 07

stock-summary
RIGHTS

No Rights history available

stock-summaryKey Factors

Quality key factors stock-summary

Factor
Value
Sales Growth (5y)
-0.77%
EBIT Growth (5y)
1.09%
EBIT to Interest (avg)
0.46
Debt to EBITDA (avg)
8.87
Net Debt to Equity (avg)
0.48
Sales to Capital Employed (avg)
1.26
Tax Ratio
Tax Ratio is Negative%
Dividend Payout Ratio
0
Pledged Shares
29.57%
Institutional Holding
0.12%
ROCE (avg)
1.02%
ROE (avg)
1.62%

Valuation key factors

Factor
Value
P/E Ratio
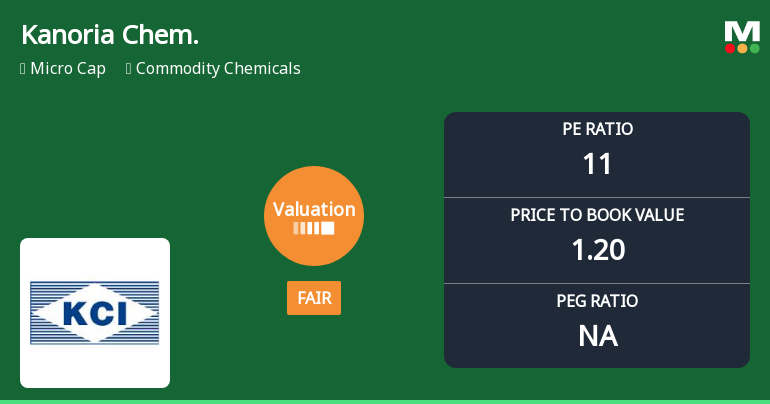
11
Industry P/E
43
Price to Book Value
1.19
EV to EBIT
15.36
EV to EBITDA
9.77
EV to Capital Employed
1.13
EV to Sales
0.77
PEG Ratio
NA
Dividend Yield
NA
ROCE (Latest)
4.26%
ROE (Latest)
6.97%

Technicals key factors

Indicator
Weekly
Monthly
MACD
Bullish
Bullish
RSI
No Signal
Bearish
Bollinger Bands
Mildly Bullish
Mildly Bullish
Moving Averages
Bullish (Daily)
KST
Bullish
Bullish
Dow Theory
No Trend
No Trend
OBV
No Trend
No Trend
stock-summary Technical Indicator Scale: Bearish, Mildly Bearish, Sideways, Mildly Bullish, Bullish  Turned 
stock-summaryShareholding
Shareholding Snapshot : Jun 2026stock-summary
Shareholding Compare (%holding) stock-summary
Majority shareholders

Promoters

Pledged Promoter Holdings

29.5708

Mutual Funds

Held by 4 Schemes (0.07%)

FIIs

Held by 3 FIIs (0.05%)

Promoter with highest holding

Vardhan Limited (59.94%)

Highest Public shareholder

Sanjiv Dhireshbhai Shah (3.97%)

Individual Investors Holdings

21.13%

stock-summaryFinancial
[
  {
    "link": "quarterly",
    "btn_text": "All Quarterly Results",
    "header": "Quarterly Results Snapshot (Consolidated) - Jun'26 - QoQ",
    "rhs": [
      {
        "prefix": "Net Sales ",
        "suffix": "QoQ Growth in quarter ended Jun 2026 is 51.24% vs 14.51% in Mar 2026",
        "dir": 1
      },
      {
        "prefix": "Consolidated Net Profit ",
        "suffix": "QoQ Growth in quarter ended Jun 2026 is -16.64% vs 790.70% in Mar 2026",
        "dir": -1
      }
    ],
    "table": {
      "header": [
        "Jun'26",
        "Mar'26",
        "Change(%)"
      ],
      "body": [
        {
          "field": "Net Sales",
          "val1": "460.37",
          "val2": "304.39",
          "chgp": "51.24%",
          "chgp_class": "positive"
        },
        {
          "field": "Operating Profit (PBDIT) excl Other Income",
          "val1": "45.01",
          "val2": "27.10",
          "chgp": "66.09%",
          "chgp_class": "positive"
        },
        {
          "field": "Interest",
          "val1": "7.32",
          "val2": "8.38",
          "chgp": "-12.65%",
          "chgp_class": "positive"
        },
        {
          "field": "Exceptional Items",
          "val1": "0.00",
          "val2": "0.00",
          "chgp": "",
          "chgp_class": "neutral"
        },
        {
          "field": "Consolidate Net Profit",
          "val1": "26.36",
          "val2": "31.62",
          "chgp": "-16.64%",
          "chgp_class": "negative"
        },
        {
          "field": "Operating Profit Margin (Excl OI)",
          "val1": "9.78%",
          "val2": "8.90%",
          "chgp": "0.88%",
          "chgp_class": "positive"
        }
      ]
    }
  },
  {
    "link": "half-yearly",
    "btn_text": "All Half Yearly Results",
    "header": "Half Yearly Results Snapshot (Consolidated) - Sep'25",
    "rhs": [
      {
        "prefix": "Net Sales ",
        "suffix": " Growth in half year ended Sep 2025 is 14.20% vs -53.41% in Sep 2024",
        "dir": 1
      },
      {
        "prefix": "Consolidated Net Profit ",
        "suffix": " Growth in half year ended Sep 2025 is 380.23% vs -45.41% in Sep 2024",
        "dir": 1
      }
    ],
    "table": {
      "header": [
        "Sep'25",
        "Sep'24",
        "Change(%)"
      ],
      "body": [
        {
          "field": "Net Sales",
          "val1": "411.22",
          "val2": "360.08",
          "chgp": "14.20%",
          "chgp_class": "positive"
        },
        {
          "field": "Operating Profit (PBDIT) excl Other Income",
          "val1": "24.36",
          "val2": "4.98",
          "chgp": "389.16%",
          "chgp_class": "positive"
        },
        {
          "field": "Interest",
          "val1": "15.94",
          "val2": "15.55",
          "chgp": "2.51%",
          "chgp_class": "negative"
        },
        {
          "field": "Exceptional Items",
          "val1": "80.82",
          "val2": "-18.64",
          "chgp": "533.58%",
          "chgp_class": "positive"
        },
        {
          "field": "Consolidate Net Profit",
          "val1": "85.61",
          "val2": "-30.55",
          "chgp": "380.23%",
          "chgp_class": "positive"
        },
        {
          "field": "Operating Profit Margin (Excl OI)",
          "val1": "5.92%",
          "val2": "1.38%",
          "chgp": "4.54%",
          "chgp_class": "positive"
        }
      ]
    }
  },
  {
    "link": "nine-monthly",
    "btn_text": "All Nine Monthly Results",
    "header": "Nine Monthly Results Snapshot (Consolidated) - Dec'25",
    "rhs": [
      {
        "prefix": "Net Sales ",
        "suffix": "YoY Growth in nine months ended Dec 2025 is 25.28% vs -51.52% in Dec 2024",
        "dir": 1
      },
      {
        "prefix": "Consolidated Net Profit ",
        "suffix": "YoY Growth in nine months ended Dec 2025 is 288.82% vs -62.05% in Dec 2024",
        "dir": 1
      }
    ],
    "table": {
      "header": [
        "Dec'25",
        "Dec'24",
        "Change(%)"
      ],
      "body": [
        {
          "field": "Net Sales",
          "val1": "677.04",
          "val2": "540.43",
          "chgp": "25.28%",
          "chgp_class": "positive"
        },
        {
          "field": "Operating Profit (PBDIT) excl Other Income",
          "val1": "44.24",
          "val2": "20.10",
          "chgp": "120.10%",
          "chgp_class": "positive"
        },
        {
          "field": "Interest",
          "val1": "23.60",
          "val2": "23.68",
          "chgp": "-0.34%",
          "chgp_class": "positive"
        },
        {
          "field": "Exceptional Items",
          "val1": "80.82",
          "val2": "-45.20",
          "chgp": "278.81%",
          "chgp_class": "positive"
        },
        {
          "field": "Consolidate Net Profit",
          "val1": "89.16",
          "val2": "-47.22",
          "chgp": "288.82%",
          "chgp_class": "positive"
        },
        {
          "field": "Operating Profit Margin (Excl OI)",
          "val1": "6.53%",
          "val2": "3.72%",
          "chgp": "2.81%",
          "chgp_class": "positive"
        }
      ]
    }
  },
  {
    "link": "annual",
    "btn_text": "All Annual Results",
    "header": "Annual Results Snapshot (Consolidated) - Mar'26",
    "rhs": [
      {
        "prefix": "Net Sales ",
        "suffix": "YoY Growth in year ended Mar 2026 is 30.11% vs -48.86% in Mar 2025",
        "dir": 1
      },
      {
        "prefix": "Consolidated Net Profit ",
        "suffix": "YoY Growth in year ended Mar 2026 is 244.47% vs -117.71% in Mar 2025",
        "dir": 1
      }
    ],
    "table": {
      "header": [
        "Mar'26",
        "Mar'25",
        "Change(%)"
      ],
      "body": [
        {
          "field": "Net Sales",
          "val1": "981.43",
          "val2": "754.31",
          "chgp": "30.11%",
          "chgp_class": "positive"
        },
        {
          "field": "Operating Profit (PBDIT) excl Other Income",
          "val1": "71.34",
          "val2": "32.63",
          "chgp": "118.63%",
          "chgp_class": "positive"
        },
        {
          "field": "Interest",
          "val1": "31.98",
          "val2": "31.06",
          "chgp": "2.96%",
          "chgp_class": "negative"
        },
        {
          "field": "Exceptional Items",
          "val1": "80.82",
          "val2": "-83.10",
          "chgp": "197.26%",
          "chgp_class": "positive"
        },
        {
          "field": "Consolidate Net Profit",
          "val1": "120.78",
          "val2": "-83.60",
          "chgp": "244.47%",
          "chgp_class": "positive"
        },
        {
          "field": "Operating Profit Margin (Excl OI)",
          "val1": "7.27%",
          "val2": "4.33%",
          "chgp": "2.94%",
          "chgp_class": "positive"
        }
      ]
    }
  }
]

Quarterly Results Snapshot (Consolidated) - Jun'26 - QoQstock-summary

Jun'26
Mar'26
Change(%)
Net Sales
460.37
304.39
51.24%
Operating Profit (PBDIT) excl Other Income
45.01
27.10
66.09%
Interest
7.32
8.38
-12.65%
Exceptional Items
0.00
0.00
Consolidate Net Profit
26.36
31.62
-16.64%
Operating Profit Margin (Excl OI)
9.78%
8.90%
0.88%
Values in Rs Cr.
Direction Arrows
Net Sales

QoQ Growth in quarter ended Jun 2026 is 51.24% vs 14.51% in Mar 2026

Direction Arrows
Consolidated Net Profit

QoQ Growth in quarter ended Jun 2026 is -16.64% vs 790.70% in Mar 2026

Half Yearly Results Snapshot (Consolidated) - Sep'25stock-summary

Sep'25
Sep'24
Change(%)
Net Sales
411.22
360.08
14.20%
Operating Profit (PBDIT) excl Other Income
24.36
4.98
389.16%
Interest
15.94
15.55
2.51%
Exceptional Items
80.82
-18.64
533.58%
Consolidate Net Profit
85.61
-30.55
380.23%
Operating Profit Margin (Excl OI)
5.92%
1.38%
4.54%
Values in Rs Cr.
Direction Arrows
Net Sales

Growth in half year ended Sep 2025 is 14.20% vs -53.41% in Sep 2024

Direction Arrows
Consolidated Net Profit

Growth in half year ended Sep 2025 is 380.23% vs -45.41% in Sep 2024

Nine Monthly Results Snapshot (Consolidated) - Dec'25stock-summary

Dec'25
Dec'24
Change(%)
Net Sales
677.04
540.43
25.28%
Operating Profit (PBDIT) excl Other Income
44.24
20.10
120.10%
Interest
23.60
23.68
-0.34%
Exceptional Items
80.82
-45.20
278.81%
Consolidate Net Profit
89.16
-47.22
288.82%
Operating Profit Margin (Excl OI)
6.53%
3.72%
2.81%
Values in Rs Cr.
Direction Arrows
Net Sales

YoY Growth in nine months ended Dec 2025 is 25.28% vs -51.52% in Dec 2024

Direction Arrows
Consolidated Net Profit

YoY Growth in nine months ended Dec 2025 is 288.82% vs -62.05% in Dec 2024

Annual Results Snapshot (Consolidated) - Mar'26stock-summary

Mar'26
Mar'25
Change(%)
Net Sales
981.43
754.31
30.11%
Operating Profit (PBDIT) excl Other Income
71.34
32.63
118.63%
Interest
31.98
31.06
2.96%
Exceptional Items
80.82
-83.10
197.26%
Consolidate Net Profit
120.78
-83.60
244.47%
Operating Profit Margin (Excl OI)
7.27%
4.33%
2.94%
Values in Rs Cr.
Direction Arrows
Net Sales

YoY Growth in year ended Mar 2026 is 30.11% vs -48.86% in Mar 2025

Direction Arrows
Consolidated Net Profit

YoY Growth in year ended Mar 2026 is 244.47% vs -117.71% in Mar 2025

stock-summaryCompany CV
About Kanoria Chemicals & Industries Ltd stock-summary
stock-summary
Kanoria Chemicals & Industries Ltd
Micro Cap
Commodity Chemicals
Kanoria Chemicals and Industries Ltd (KCIL) incorporated in December, 1960 is one of the leading chemical manufacturing companies in India producing aloc chemicals and Chloro Chemicals. The Company is primarily engaged in manufacture of Industrial Chemicals in India.
Company Coordinates stock-summary
Company Details
KCI Plaza 6th Floor, 23 Ashutosh Chowdhury Avenue Kolkata West Bengal : 700019
stock-summary
Tel: +91-33-40313200
stock-summary
info@kanoriachem.com
Registrar Details
CB Management Services Pvt Ltd , (Formerly Choksey Bhargava & Co Ltd) , P-22, P 22 Bondel Road, Calcutta