
Compare Homre with Similar Stocks
Dashboard
Weak Long Term Fundamental Strength with an average Return on Equity (ROE) of 2.26%
- Poor long term growth as Operating profit has grown by an annual rate 15.10% of over the last 5 years
- Company's ability to service its debt is weak with a poor EBIT to Interest (avg) ratio of -0.07
With ROE of 10.4, it has a Very Expensive valuation with a 3.4 Price to Book Value
Reducing Promoter Confidence
Stock DNA
Gems, Jewellery And Watches
INR 37 Cr (Micro Cap)
NA (Loss Making)
22
0.00%
-0.04
10.43%
3.36
Total Returns (Price + Dividend) 
Homre for the last several years.
Risk Adjusted Returns v/s
Returns Beta

News
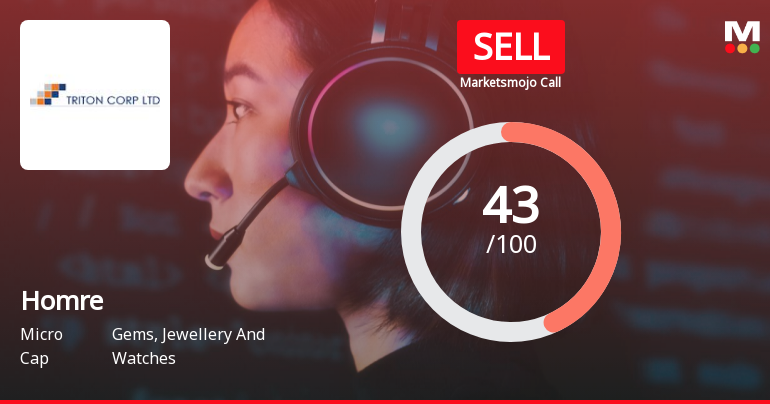
Triton Corp. Ltd is Rated Sell
Triton Corp. Ltd is rated 'Sell' by MarketsMOJO, with this rating last updated on 11 June 2026. However, the analysis and financial metrics discussed here reflect the stock's current position as of 08 July 2026, providing investors with the latest insights into the company’s fundamentals, valuation, financial trends, and technical outlook.
Read full news article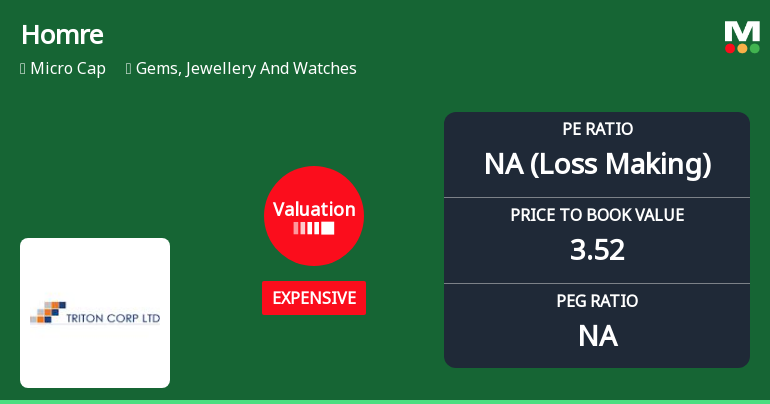
Triton Corp. Ltd Valuation Shifts Signal Price Attractiveness Change Amid Sector Dynamics
Triton Corp. Ltd, a micro-cap player in the Gems, Jewellery and Watches sector, has experienced a notable shift in its valuation parameters, prompting a downgrade in its Mojo Grade from Hold to Sell as of 11 June 2026. This article analyses the recent changes in key valuation metrics such as price-to-earnings (P/E) and price-to-book value (P/BV) ratios, compares them with historical averages and peer benchmarks, and examines the implications for investors amid a challenging market environment.
Read full news article
Triton Corp. Ltd is Rated Sell
Triton Corp. Ltd is rated 'Sell' by MarketsMOJO, with this rating last updated on 11 June 2026. However, the analysis and financial metrics discussed here reflect the stock's current position as of 25 June 2026, providing investors with the latest insights into the company's fundamentals, valuation, financial trends, and technical outlook.
Read full news article Announcements
Closure of Trading Window
30-Jun-2026 | Source : BSEIntimation for Closure of Trading Window
Announcement under Regulation 30 (LODR)-Change in Management
29-Jun-2026 | Source : BSEChange in Management
Announcement under Regulation 30 (LODR)-Change in Management
22-Jun-2026 | Source : BSEResignation Received From Independent Director
Corporate Actions

No Upcoming Board Meetings

No Dividend history available

Homre Ltd has announced 1:2 stock split, ex-date: 18 Feb 08

No Bonus history available

No Rights history available
Quality key factors
Valuation key factors
Technicals key factors
 Technical Indicator Scale: Bearish, Mildly Bearish, Sideways, Mildly Bullish, Bullish Turned
 Shareholding Snapshot : Mar 2026
Shareholding Compare (%holding)
Promoters
None
Held by 5 Schemes (0.1%)
Held by 1 FIIs (0.23%)
Rajendra Seclease Limited (43.16%)
Sai Info Plc (1.72%)
31.05%
Quarterly Results Snapshot (Consolidated) - Mar'26 - YoY
YoY Growth in quarter ended Mar 2026 is 0.00% vs 0.00% in Mar 2025

YoY Growth in quarter ended Mar 2026 is -300.00% vs 265.22% in Mar 2025
Half Yearly Results Snapshot (Consolidated) - Sep'25
Growth in half year ended Sep 2025 is 0.00% vs 0.00% in Sep 2024

Growth in half year ended Sep 2025 is 273.68% vs -111.11% in Sep 2024
Nine Monthly Results Snapshot (Consolidated) - Dec'25
YoY Growth in nine months ended Dec 2025 is 0.00% vs 0.00% in Dec 2024
YoY Growth in nine months ended Dec 2025 is 296.55% vs -45.00% in Dec 2024
Annual Results Snapshot (Consolidated) - Mar'26
YoY Growth in year ended Mar 2026 is 0.00% vs 0.00% in Mar 2025
YoY Growth in year ended Mar 2026 is -125.00% vs 118.18% in Mar 2025
About Homre Ltd

Company Coordinates


