
Compare Homre with Similar Stocks
Dashboard
Weak Long Term Fundamental Strength with an average Return on Equity (ROE) of 2.26%
- Poor long term growth as Operating profit has grown by an annual rate 15.10% of over the last 5 years
- Company's ability to service its debt is weak with a poor EBIT to Interest (avg) ratio of -0.07
With ROE of 10.4, it has a Very Expensive valuation with a 3.7 Price to Book Value
Reducing Promoter Confidence
Stock DNA
Gems, Jewellery And Watches
INR 42 Cr (Micro Cap)
155.00
25
0.00%
-0.04
10.43%
3.66
Total Returns (Price + Dividend) 
Homre for the last several years.
Risk Adjusted Returns v/s
Returns Beta

News
Are Triton Corp. Ltd latest results good or bad?
Triton Corp. Ltd's latest financial results for Q1 FY27 present a mixed picture of growth and challenges. The company reported a net profit of ₹0.63 crore, marking a significant turnaround from a loss in the previous quarter. Revenue doubled quarter-on-quarter to ₹11.92 crores, indicating a strong top-line performance. However, this growth comes with concerns regarding profitability, as the operating margin fell sharply to 3.10% from 9.73% in the prior quarter. This decline raises questions about the sustainability of the revenue growth, particularly given the heavy reliance on other income, which constituted a substantial portion of the operating profit. The return on equity (ROE) improved to 10.43%, reflecting a recovery from previous lows, yet it remains below industry standards. The balance sheet appears relatively stable with no long-term debt, but the company continues to face challenges related to w...
Read full news article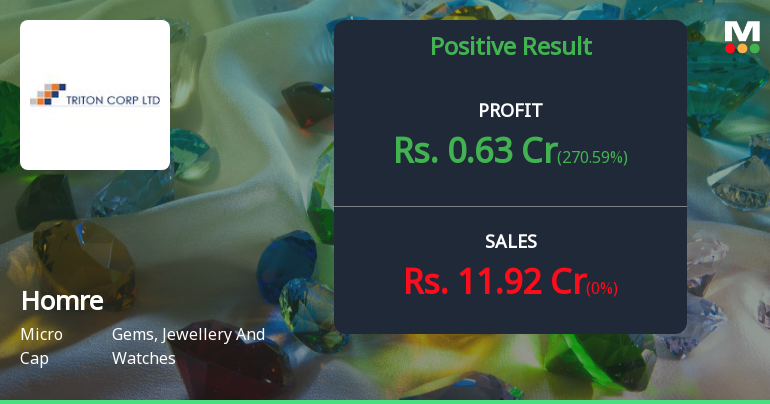
Homre Ltd Q1 FY27: Revenue Surge Masks Underlying Profitability Concerns
Homre Ltd., a micro-cap player in the gems, jewellery, and watches sector, reported a dramatic turnaround in its Q1 FY27 results, with net profit surging to ₹0.63 crores from a loss of ₹0.76 crores in the previous quarter. However, beneath the headline numbers lies a concerning narrative of margin compression and questionable earnings quality that demands closer scrutiny from investors.
Read full news articleAre Triton Corp. Ltd latest results good or bad?
Triton Corp. Ltd's latest financial results for Q4 FY26 present a complex picture. The company reported net sales of ₹5.96 crores, which reflects a sequential decline of 13.37% from the previous quarter, following a significant surge in the prior quarter. This revenue pattern suggests some normalization after an unusually strong performance, indicating operational volatility. The net profit for the quarter was reported at a loss of ₹0.76 crores, a substantial decline attributed primarily to an exceptional tax provision of 255.10%, which significantly overshadowed the operational gains. This tax rate is highly unusual and raises concerns regarding the company’s financial management and transparency. The operating margin, however, showed a positive trend, reaching 9.73%, the highest in recent quarters, indicating improvements in operational efficiency and cost management. Despite the operational gains refle...
Read full news article Announcements
Announcement under Regulation 30 (LODR)-Newspaper Publication
24-Jul-2026 | Source : BSENewspaper publication under regulation 47 of the SEBI (LODR) Regulation 2015
Announcement under Regulation 30 (LODR)-Resignation of Director
24-Jul-2026 | Source : BSEintimation of resignation of executive director under regulation 30 of SEBI (LODR) regulation 2015. In Refrence To Email dated on 24-07- 2026 From BSE Limited
Financial Results For The Quarter Ended June 30 2026
23-Jul-2026 | Source : BSEUn-audited Financial Results for the quarter ended June 30 2026
Corporate Actions

No Upcoming Board Meetings

No Dividend history available

Homre Ltd has announced 1:2 stock split, ex-date: 18 Feb 08

No Bonus history available

No Rights history available
Quality key factors
Valuation key factors
Technicals key factors
 Technical Indicator Scale: Bearish, Mildly Bearish, Sideways, Mildly Bullish, Bullish Turned
 Shareholding Snapshot : Jun 2026
Shareholding Compare (%holding)
Promoters
None
Held by 5 Schemes (0.1%)
Held by 1 FIIs (0.23%)
Rajendra Seclease Limited (42.96%)
Sai Info Plc (1.72%)
31.68%
Quarterly Results Snapshot (Consolidated) - Jun'26 - YoY
YoY Growth in quarter ended Jun 2026 is 0.00% vs 0.00% in Jun 2025

YoY Growth in quarter ended Jun 2026 is 270.59% vs 270.00% in Jun 2025
Half Yearly Results Snapshot (Consolidated) - Sep'25
Growth in half year ended Sep 2025 is 0.00% vs 0.00% in Sep 2024
Growth in half year ended Sep 2025 is 273.68% vs -111.11% in Sep 2024
Nine Monthly Results Snapshot (Consolidated) - Dec'25
YoY Growth in nine months ended Dec 2025 is 0.00% vs 0.00% in Dec 2024
YoY Growth in nine months ended Dec 2025 is 296.55% vs -45.00% in Dec 2024
Annual Results Snapshot (Consolidated) - Mar'26
YoY Growth in year ended Mar 2026 is 0.00% vs 0.00% in Mar 2025

YoY Growth in year ended Mar 2026 is -125.00% vs 118.18% in Mar 2025
About Homre Ltd

Company Coordinates


