
Compare Mini Diamonds(I) with Similar Stocks
Dashboard
With a Operating Losses, the company has a Weak Long Term Fundamental Strength
- Low ability to service debt as the company has a high Debt to EBITDA ratio of 1.21 times
- PAT(Q) At Rs -5.74 cr has Fallen at -612.5% (vs previous 4Q average)
- ROCE(HY) Lowest at 3.40%
- PBDIT(Q) Lowest at Rs -8.21 cr.
With ROE of 3.5, it has a Expensive valuation with a 2.3 Price to Book Value
Underperformed the market in the last 1 year
Stock DNA
Gems, Jewellery And Watches
INR 145 Cr (Micro Cap)
97.00
47
0.00%
0.02
3.53%
2.26
Total Returns (Price + Dividend) 
Mini Diamonds(I) for the last several years.
Risk Adjusted Returns v/s
Returns Beta

News
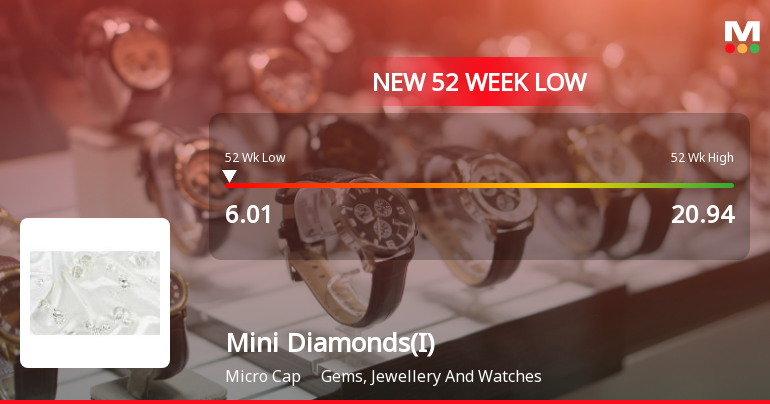
Mini Diamonds (India) Ltd Falls to 52-Week Low of Rs 6.01 as Sell-Off Deepens
For the sixth consecutive session, Mini Diamonds (India) Ltd has closed lower, culminating in a fresh 52-week low of Rs 6.01 on 24 Jun 2026. This marks a steep 21.42% decline over this losing streak, underscoring persistent selling pressure despite broader market gains.
Read full news article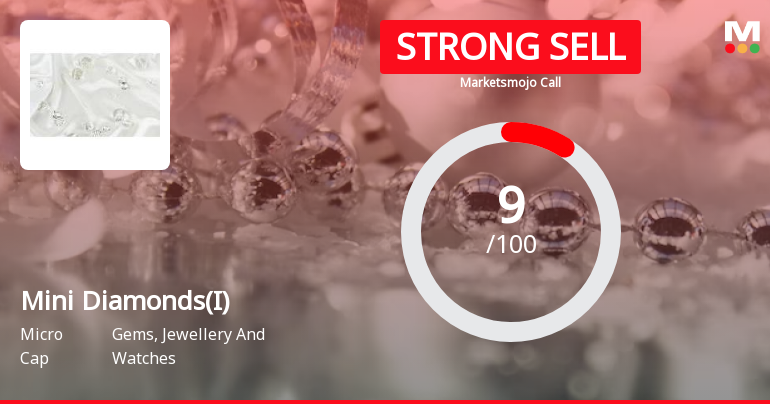
Mini Diamonds (India) Ltd is Rated Strong Sell
Mini Diamonds (India) Ltd is rated Strong Sell by MarketsMOJO, with this rating last updated on 01 June 2026. However, the analysis and financial metrics discussed here reflect the stock’s current position as of 24 June 2026, providing investors with the latest insights into its performance and outlook.
Read full news article
Five Consecutive Losses Push Mini Diamonds (India) Ltd to a New 52-Week Low
For the fifth consecutive session, Mini Diamonds (India) Ltd has closed lower, hitting a fresh 52-week low of Rs 6.06 on 23 Jun 2026. This marks a steep 20.13% decline over the past five days, underscoring persistent selling pressure despite a broadly positive market backdrop.
Read full news article Announcements
Announcement under Regulation 30 (LODR)-Allotment
17-Jun-2026 | Source : BSEAllotment of Bonus Equity Shares of Mini Diamonds (India) Limited.
Announcement under Regulation 30 (LODR)-Award_of_Order_Receipt_of_Order
16-Jun-2026 | Source : BSEReceipt of Signiificant Domestic Order for Cut and Polished Natural Diamonds amouting too INR 16.25 Crores
Announcement under Regulation 30 (LODR)-Award_of_Order_Receipt_of_Order
15-Jun-2026 | Source : BSEReceipt of Significant Domestic Order for Cut and Polished Lab Grown Diamonds amouting to INR 14.00 Crores
Corporate Actions

No Upcoming Board Meetings

No Dividend history available

Mini Diamonds (India) Ltd has announced 2:10 stock split, ex-date: 02 Dec 25

Mini Diamonds (India) Ltd has announced 1:1 bonus issue, ex-date: 16 Jun 26

No Rights history available
Quality key factors
Valuation key factors
Technicals key factors
 Technical Indicator Scale: Bearish, Mildly Bearish, Sideways, Mildly Bullish, Bullish Turned
 Shareholding Snapshot : Mar 2026
Shareholding Compare (%holding)
Non Institution
None
Held by 0 Schemes
Held by 0 FIIs
Late Meena Upendra Shah (1.11%)
Shashank Pravinchandra Doshi (8.91%)
57.4%
Quarterly Results Snapshot (Standalone) - Mar'26 - QoQ

QoQ Growth in quarter ended Mar 2026 is -9.20% vs 11.51% in Dec 2025
QoQ Growth in quarter ended Mar 2026 is -257.98% vs 17.27% in Dec 2025
Half Yearly Results Snapshot (Standalone) - Sep'25
Growth in half year ended Sep 2025 is 29.40% vs 117.99% in Sep 2024
Growth in half year ended Sep 2025 is 18.25% vs 1,026.19% in Sep 2024
Nine Monthly Results Snapshot (Standalone) - Dec'25
YoY Growth in nine months ended Dec 2025 is 34.90% vs 91.93% in Dec 2024
YoY Growth in nine months ended Dec 2025 is 28.01% vs 667.50% in Dec 2024
Annual Results Snapshot (Standalone) - Mar'26
YoY Growth in year ended Mar 2026 is 40.01% vs 65.15% in Mar 2025
YoY Growth in year ended Mar 2026 is -53.49% vs 60.00% in Mar 2025
About Mini Diamonds (India) Ltd

Company Coordinates


