
Compare Mini Diamonds(I) with Similar Stocks
Dashboard
With a Operating Losses, the company has a Weak Long Term Fundamental Strength
- Low ability to service debt as the company has a high Debt to EBITDA ratio of 1.21 times
- PAT(Q) At Rs -5.74 cr has Fallen at -612.5% (vs previous 4Q average)
- ROCE(HY) Lowest at 3.40%
- PBDIT(Q) Lowest at Rs -8.21 cr.
With ROE of 3.5, it has a Expensive valuation with a 2.1 Price to Book Value
Underperformed the market in the last 1 year
Stock DNA
Gems, Jewellery And Watches
INR 140 Cr (Micro Cap)
91.00
52
0.00%
0.02
3.53%
2.19
Total Returns (Price + Dividend) 
Mini Diamonds(I) for the last several years.
Risk Adjusted Returns v/s
Returns Beta

News

Mini Diamonds (India) Ltd is Rated Strong Sell
Mini Diamonds (India) Ltd is rated Strong Sell by MarketsMOJO, with this rating last updated on 01 June 2026. However, the analysis and financial metrics presented here reflect the stock’s current position as of 17 July 2026, providing investors with the latest insights into the company’s performance and outlook.
Read full news article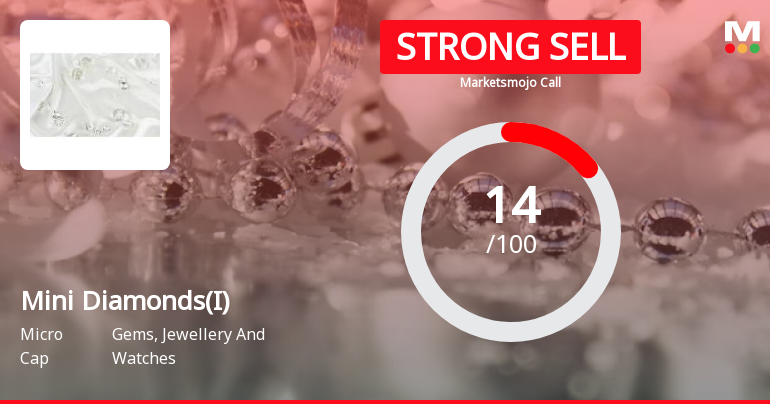
Mini Diamonds (India) Ltd is Rated Strong Sell
Mini Diamonds (India) Ltd is rated Strong Sell by MarketsMOJO, with this rating last updated on 01 June 2026. However, the analysis and financial metrics presented here reflect the company’s current position as of 06 July 2026, providing investors with the latest insights into its performance and outlook.
Read full news article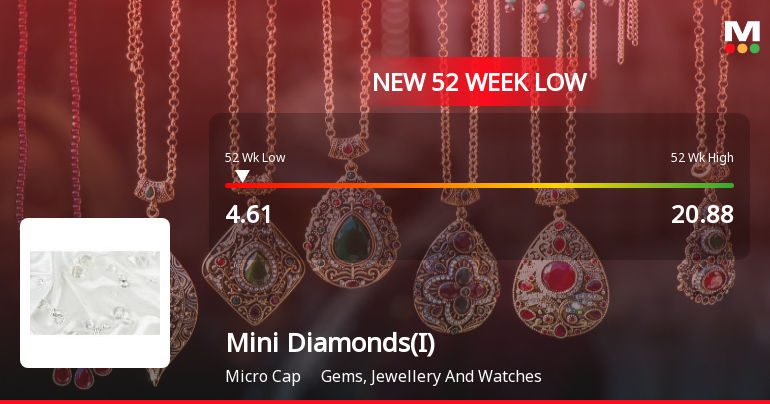
Mini Diamonds (India) Ltd Falls to 52-Week Low of Rs 4.61 as Sell-Off Deepens
For the tenth consecutive session, Mini Diamonds (India) Ltd has closed lower, culminating in a fresh 52-week low of Rs 4.61 on 1 Jul 2026. This marks a steep 35.48% decline over this losing streak and a staggering 72.82% drop over the past year, sharply underperforming the Sensex’s modest 8.29% fall.
Read full news article Announcements
Announcement under Regulation 30 (LODR)-Newspaper Publication
16-Jul-2026 | Source : BSEMini Diamonds (India) Limited informs the Exchange about Copy of Newspaper Publication.
Extra-Ordinary General Meeting Of The Company Scheduled To Be Held On Friday August 07 2026.
15-Jul-2026 | Source : BSENotice of Extra-Ordinary General Meeting scheduled to be held on Friday August 07 2026.
Board Meeting Outcome for Outcome Of Board Meeting Held Today I.E. July 09 2026
09-Jul-2026 | Source : BSEOutcome of Board Meeting held today i.e. July 09 2026 for issuance of convertible warrants on preferential basis.
Corporate Actions

No Upcoming Board Meetings

No Dividend history available

Mini Diamonds (India) Ltd has announced 2:10 stock split, ex-date: 02 Dec 25

Mini Diamonds (India) Ltd has announced 1:1 bonus issue, ex-date: 16 Jun 26

No Rights history available
Quality key factors
Valuation key factors
Technicals key factors
 Technical Indicator Scale: Bearish, Mildly Bearish, Sideways, Mildly Bullish, Bullish Turned
 Shareholding Snapshot : Jun 2026
Shareholding Compare (%holding)
Non Institution
None
Held by 0 Schemes
Held by 0 FIIs
Chandrika Kailas Shah (1.47%)
Shashank Pravinchandra Doshi (8.91%)
57.43%
Quarterly Results Snapshot (Standalone) - Mar'26 - QoQ

QoQ Growth in quarter ended Mar 2026 is -9.20% vs 11.51% in Dec 2025
QoQ Growth in quarter ended Mar 2026 is -257.98% vs 17.27% in Dec 2025
Half Yearly Results Snapshot (Standalone) - Sep'25
Growth in half year ended Sep 2025 is 29.40% vs 117.99% in Sep 2024
Growth in half year ended Sep 2025 is 18.25% vs 1,026.19% in Sep 2024
Nine Monthly Results Snapshot (Standalone) - Dec'25
YoY Growth in nine months ended Dec 2025 is 34.90% vs 91.93% in Dec 2024
YoY Growth in nine months ended Dec 2025 is 28.01% vs 667.50% in Dec 2024
Annual Results Snapshot (Standalone) - Mar'26
YoY Growth in year ended Mar 2026 is 40.01% vs 65.15% in Mar 2025
YoY Growth in year ended Mar 2026 is -53.49% vs 60.00% in Mar 2025
About Mini Diamonds (India) Ltd

Company Coordinates


