
Compare TVS Elec. with Similar Stocks
Dashboard
With ROCE of 2.1, it has a Expensive valuation with a 6.8 Enterprise value to Capital Employed
- The stock is trading at a discount compared to its peers' average historical valuations
- Over the past year, while the stock has generated a return of 16.61%, its profits have risen by 152.6% ; the PEG ratio of the company is 2.9
Despite the size of the company, domestic mutual funds hold only 0.02% of the company
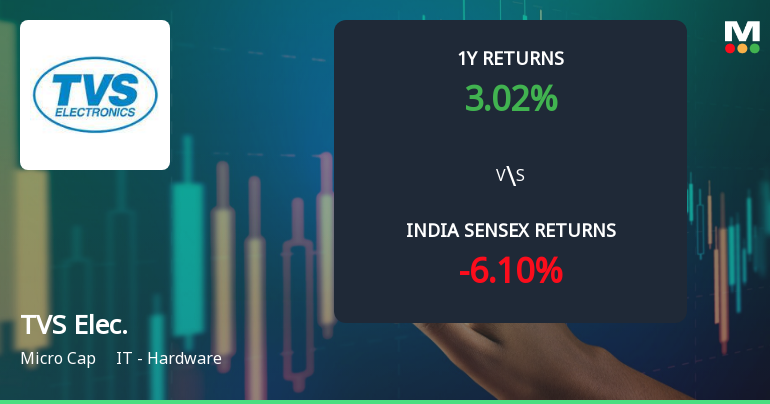
Total Returns (Price + Dividend) 
Latest dividend: 1 per share ex-dividend date: Aug-02-2024
Risk Adjusted Returns v/s
Returns Beta

News
TVS Electronics Ltd Technical Momentum Shifts Amid Mixed Indicator Signals
TVS Electronics Ltd has experienced a notable shift in its technical momentum, moving from a mildly bearish stance to a sideways trend, reflecting a complex interplay of bullish and bearish signals across key technical indicators. Despite a modest day gain of 1.01%, the stock remains under pressure with a MarketsMOJO grade downgrade from Hold to Sell, underscoring cautious investor sentiment amid mixed market cues.
Read full news article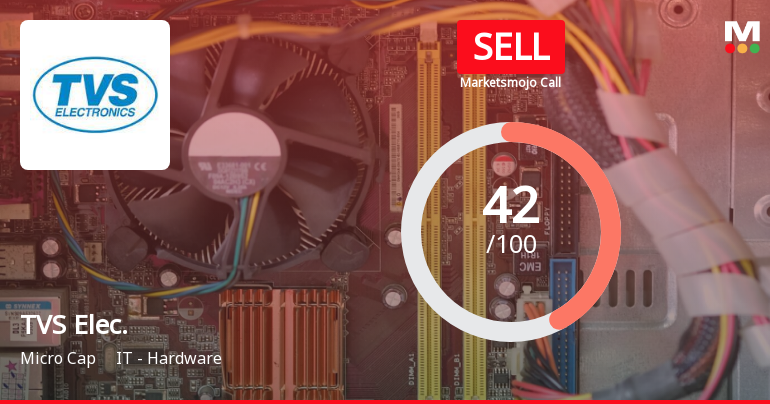
TVS Electronics Ltd is Rated Sell
TVS Electronics Ltd is rated 'Sell' by MarketsMOJO, with this rating last updated on 01 June 2026. However, the analysis and financial metrics discussed here reflect the stock's current position as of 12 June 2026, providing investors with the latest insights into the company’s performance and outlook.
Read full news article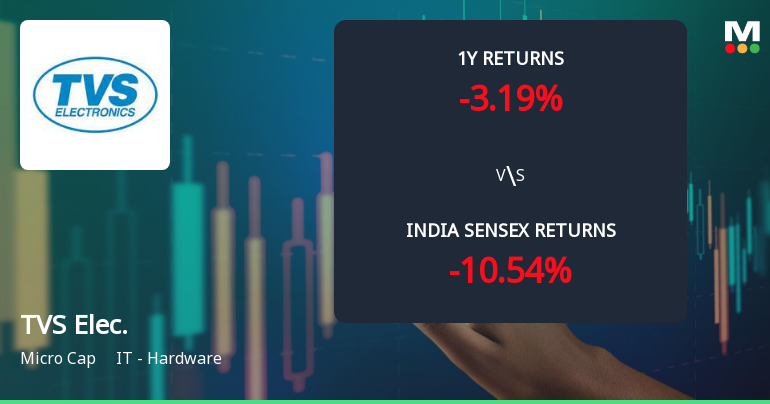
TVS Electronics Ltd Faces Mildly Bearish Momentum Amid Technical Shifts
TVS Electronics Ltd, a micro-cap player in the IT - Hardware sector, has experienced a notable shift in its technical momentum, moving from a sideways trend to a mildly bearish stance. Despite some bullish weekly indicators, the overall technical landscape suggests caution for investors as the stock price declined by 2.95% on 9 June 2026, closing at ₹456.65.
Read full news article Announcements
Announcement under Regulation 30 (LODR)-Newspaper Publication
10-Jun-2026 | Source : BSESubmission of newspaper publication - Notice issued pursuant to the IEPF Rules.
Announcement under Regulation 30 (LODR)-Newspaper Publication
01-Jun-2026 | Source : BSECopy of Newspaper Publication-Shifting of Registered Office from 2nd floor to 4th Floor(within the same building) w.e.f 1st June 2026
Announcement under Regulation 30 (LODR)-Change in Registered Office Address
01-Jun-2026 | Source : BSEShifting of Registered Office from 2nd floor to 4th floor(within the same building) w.e.f 1st June 2026
Corporate Actions

No Upcoming Board Meetings

TVS Electronics Ltd has declared 10% dividend, ex-date: 02 Aug 24

No Splits history available

No Bonus history available

No Rights history available
Quality key factors
Valuation key factors
Technicals key factors
 Technical Indicator Scale: Bearish, Mildly Bearish, Sideways, Mildly Bullish, Bullish Turned
 Shareholding Snapshot : Mar 2026
Shareholding Compare (%holding)
Promoters
None
Held by 3 Schemes (0.01%)
Held by 2 FIIs (0.01%)
Gopal Srinivasan (59.71%)
Abhijit Periwal (2.23%)
31.91%
Quarterly Results Snapshot (Standalone) - Mar'26 - QoQ

QoQ Growth in quarter ended Mar 2026 is 3.36% vs -10.90% in Dec 2025
QoQ Growth in quarter ended Mar 2026 is 595.12% vs -73.55% in Dec 2025
Half Yearly Results Snapshot (Standalone) - Sep'25

Growth in half year ended Sep 2025 is 3.79% vs 18.80% in Sep 2024
Growth in half year ended Sep 2025 is 22.48% vs -279.17% in Sep 2024
Nine Monthly Results Snapshot (Standalone) - Dec'25
YoY Growth in nine months ended Dec 2025 is 6.92% vs 17.55% in Dec 2024
YoY Growth in nine months ended Dec 2025 is 50.77% vs -976.67% in Dec 2024
Annual Results Snapshot (Standalone) - Mar'26
YoY Growth in year ended Mar 2026 is 5.73% vs 17.67% in Mar 2025
YoY Growth in year ended Mar 2026 is 133.25% vs -1,503.70% in Mar 2025
About TVS Electronics Ltd

Company Coordinates


