
Compare T N Steel Tubes with Similar Stocks
Dashboard
Weak Long Term Fundamental Strength with an average Return on Capital Employed (ROCE) of 2.51%
- Poor long term growth as Net Sales has grown by an annual rate of 12.07% and Operating profit at 15.55% over the last 5 years
- Low ability to service debt as the company has a high Debt to EBITDA ratio of 7.76 times
Positive results in Mar 26
With ROCE of 4.9, it has a Attractive valuation with a 1.2 Enterprise value to Capital Employed
Majority shareholders : Non Institution
Market Beating performance in long term as well as near term
Stock DNA
Iron & Steel Products
INR 14 Cr (Micro Cap)
229.00
9
0.00%
0.73
0.61%
1.38
Total Returns (Price + Dividend) 
T N Steel Tubes for the last several years.
Risk Adjusted Returns v/s
Returns Beta

News

Tamilnadu Steel Tubes Ltd Upgraded to Hold on Technical and Valuation Improvements
Tamilnadu Steel Tubes Ltd (T N Steel Tubes) has seen its investment rating upgraded from Sell to Hold, reflecting a notable improvement in technical indicators and valuation metrics despite ongoing challenges in its financial trend and quality parameters. The upgrade, effective from 28 July 2026, comes amid a mixed but cautiously optimistic outlook for the micro-cap iron and steel products company.
Read full news article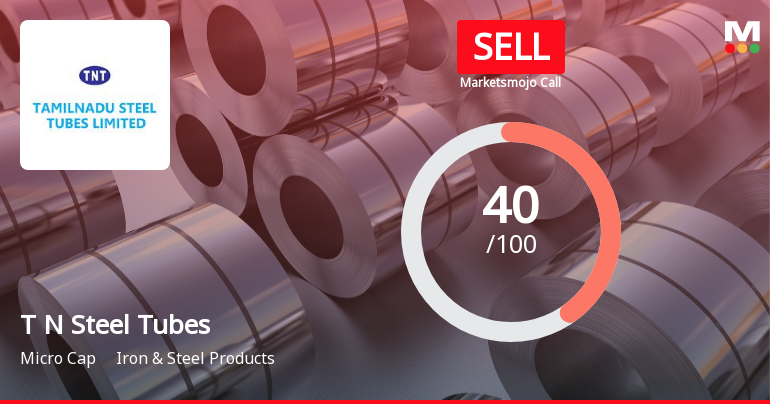
Tamilnadu Steel Tubes Ltd Downgraded to Sell Amid Mixed Financial and Technical Signals
Tamilnadu Steel Tubes Ltd (T N Steel Tubes), a micro-cap player in the Iron & Steel Products sector, has seen its investment rating downgraded from Hold to Sell as of 22 July 2026. This revision reflects a complex interplay of deteriorating technical indicators, modest financial trends, valuation considerations, and overall quality concerns, despite some recent positive quarterly results.
Read full news article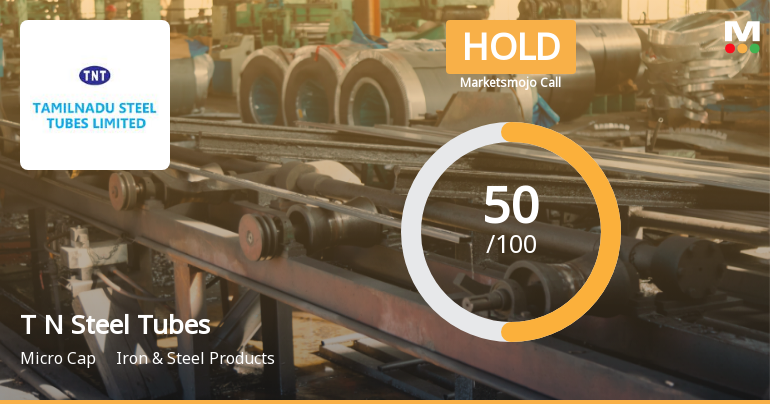
Tamilnadu Steel Tubes Ltd Upgraded to Hold on Technical and Financial Improvements
Tamilnadu Steel Tubes Ltd has seen its investment rating upgraded from Sell to Hold, reflecting a notable shift in technical indicators and improved quarterly financial performance. The company’s valuation remains attractive despite some lingering fundamental challenges, while its technical trend has turned mildly bullish, signalling cautious optimism among investors.
Read full news article Announcements
Compliances-Certificate under Reg. 74 (5) of SEBI (DP) Regulations 2018
10-Jul-2026 | Source : BSEIn compliance of REG 74(5)of SEBI(DP) Regulation 2018. We forward the Certificate Received from our RTA M/s Cameo Corporate Service limited. for the QE 30.06.2026. Kindly take the same on record.
Closure of Trading Window
26-Jun-2026 | Source : BSEThe Trading Window for dealing in shares of the company for all the Designated Persons will remain closed from 01.07.2026 till the expiry of the 48 hrs after the declaration of the Unaudited financial results for QE 30.06.2026. Date of Board Meeting to consider and take on Record the unaudited financial results for the QE 30.06.2026 will intimated to the BSE separately in due course.
Format of the Initial Disclosure to be made by an entity identified as a Large Corporate : Annexure A
23-Jun-2026 | Source : BSEFormat of Initial Disclosure to be made by an entity identified as a Large Corporate.
| Sr. No. | Particulars | Details |
| 1 | Name of Company | Tamilnadu Steel Tubes Ltd |
| 2 | CIN NO. | L27110TN1979PLC007887 |
| 3 | Outstanding borrowing of company as on 31st March / 31st December as applicable (in Rs cr) | 10.31 |
| 4 | Highest Credit Rating during the previous FY | NA |
| 4a | Name of the Credit Rating Agency issuing the Credit Rating mentioned in (4) | Not Applicable |
| 5 | Name of Stock Exchange# in which the fine shall be paid in case of shortfall in the required borrowing under the framework | BSE |
Designation: Company Secretary
EmailId: tnt.share@yahoo.in
Designation: CFO
EmailId: tnt.share@yahoo.in
Date: 23/06/2026
Note: In terms para of 3.2(ii) of the circular beginning F.Y 2022 in the event of shortfall in the mandatory borrowing through debt securities a fine of 0.2% of the shortfall shall be levied by Stock Exchanges at the end of the two-year block period. Therefore an entity identified as LC shall provide in its initial disclosure for a financial year the name of Stock Exchange to which it would pay the fine in case of shortfall in the mandatory borrowing through debt markets.
Corporate Actions

No Upcoming Board Meetings

No Dividend history available

No Splits history available

No Bonus history available

No Rights history available
Quality key factors
Valuation key factors
Technicals key factors
 Technical Indicator Scale: Bearish, Mildly Bearish, Sideways, Mildly Bullish, Bullish Turned
 Shareholding Snapshot : Jun 2026
Shareholding Compare (%holding)
Non Institution
None
Held by 0 Schemes
Held by 0 FIIs
Seema Goyal (4.91%)
Kareetam Traders Ltd (19.61%)
63.25%
Quarterly Results Snapshot (Standalone) - Mar'26 - QoQ

QoQ Growth in quarter ended Mar 2026 is 35.39% vs -14.36% in Dec 2025
QoQ Growth in quarter ended Mar 2026 is 0.00% vs -100.00% in Dec 2025
Half Yearly Results Snapshot (Standalone) - Sep'25
Growth in half year ended Sep 2025 is 26.26% vs -1.81% in Sep 2024

Growth in half year ended Sep 2025 is -23.08% vs 85.71% in Sep 2024
Nine Monthly Results Snapshot (Standalone) - Dec'25
YoY Growth in nine months ended Dec 2025 is 23.68% vs 1.77% in Dec 2024
YoY Growth in nine months ended Dec 2025 is -33.33% vs 114.29% in Dec 2024
Annual Results Snapshot (Standalone) - Mar'26
YoY Growth in year ended Mar 2026 is 24.37% vs 3.30% in Mar 2025
YoY Growth in year ended Mar 2026 is -40.00% vs -64.29% in Mar 2025
About Tamilnadu Steel Tubes Ltd

Company Coordinates


