
Compare Orient Tradelink with Similar Stocks
Stock DNA
Media & Entertainment
INR 23 Cr (Micro Cap)
17.00
21
0.00%
0.14
2.24%
0.39
Total Returns (Price + Dividend) 
Orient Tradelink for the last several years.
Risk Adjusted Returns v/s
Returns Beta

News

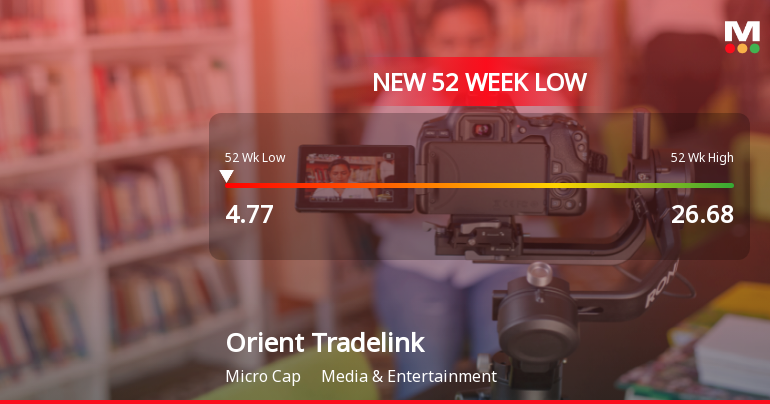
Markets Rally, But Orient Tradelink Ltd Sinks to 52-Week Low in Stock-Specific Sell-Off
Despite a broadly positive market environment with the Sensex advancing 0.32% and several indices hitting new 52-week highs, Orient Tradelink Ltd has plunged to a fresh 52-week low of Rs 4.34 on 17 Jun 2026, marking a 26.44% decline over the past seven sessions. This stark divergence highlights persistent headwinds facing the micro-cap media and entertainment company.
Read full news article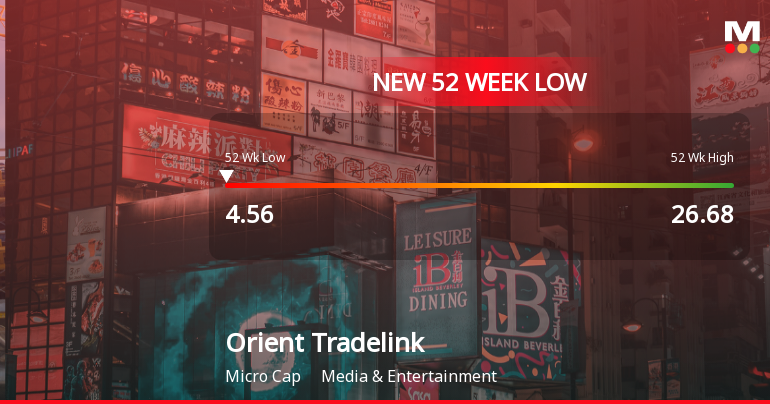
Announcements
Compliances-Certificate under Reg. 74 (5) of SEBI (DP) Regulations 2018
04-Jul-2026 | Source : BSEPursuant to Regulation 74(5) of SEBI (Depositories and Participants) Regulations 2018 please find enclosed the certificate received from Skyline Financial Services Private Limited Registrar and Share Transfer Agent of the Company for the quarter ended 30th June 2026.
Closure of Trading Window
25-Jun-2026 | Source : BSEIntimation of Closure of Trading Window for Quarter ended 30th June 2026
Announcement under Regulation 30 (LODR)-Newspaper Publication
08-Jun-2026 | Source : BSEPursuant to Regulation 30 and 47(3) read with Schedule III of SEBI (Listing Obligations and Disclosure Requirements) Regulations 2015 please find herewith attached copies of Newspaper advertisement for the statement of Standalone Audited Financial Results for the Quarter and Year ended on 31st March 2026 published on 07th June 2026 and 08th June 2026 in following newspapers: 1. Financial Express (English) having nationwide circulation. 2. Financial Express in Gujarati (Regional) language.
Corporate Actions

No Upcoming Board Meetings

No Dividend history available

Orient Tradelink Ltd has announced 10:2 stock split, ex-date: 17 Feb 21

No Bonus history available

Orient Tradelink Ltd has announced 1:1 rights issue, ex-date: 03 May 24
Quality key factors
Valuation key factors
Technicals key factors
 Technical Indicator Scale: Bearish, Mildly Bearish, Sideways, Mildly Bullish, Bullish Turned
 Shareholding Snapshot : Mar 2026
Shareholding Compare (%holding)
Non Institution
None
Held by 0 Schemes
Held by 0 FIIs
Aarti Khetarpal (0.24%)
Namita Shilpi Sinha (3.62%)
71.59%
Quarterly Results Snapshot (Standalone) - Mar'26 - YoY

YoY Growth in quarter ended Mar 2026 is -15.26% vs -13.07% in Mar 2025

YoY Growth in quarter ended Mar 2026 is 107.21% vs -63.24% in Mar 2025
Half Yearly Results Snapshot (Standalone) - Sep'25
Growth in half year ended Sep 2025 is 22.27% vs 129.35% in Sep 2024
Growth in half year ended Sep 2025 is -22.02% vs 289.29% in Sep 2024
Nine Monthly Results Snapshot (Standalone) - Dec'25
YoY Growth in nine months ended Dec 2025 is 8.34% vs 151.12% in Dec 2024
YoY Growth in nine months ended Dec 2025 is -19.87% vs 239.13% in Dec 2024
Annual Results Snapshot (Standalone) - Mar'26
YoY Growth in year ended Mar 2026 is 1.25% vs 59.32% in Mar 2025
YoY Growth in year ended Mar 2026 is 52.81% vs 394.44% in Mar 2025
About Orient Tradelink Ltd

Company Coordinates


