
Compare Tainwala Chem. with Similar Stocks
Dashboard
With a Operating Losses, the company has a Weak Long Term Fundamental Strength
- Poor long term growth as Operating profit has grown by an annual rate 15.26% of over the last 5 years
- Company's ability to service its debt is weak with a poor EBIT to Interest (avg) ratio of -1.93
With ROE of 6.3, it has a Very Expensive valuation with a 1.1 Price to Book Value
Stock DNA
Plastic Products - Industrial
INR 186 Cr (Micro Cap)
17.00
223
1.55%
-0.01
6.27%
1.05
Total Returns (Price + Dividend) 
Latest dividend: 2.9713587921847253 per share ex-dividend date: Aug-11-2025
Risk Adjusted Returns v/s
Returns Beta

News
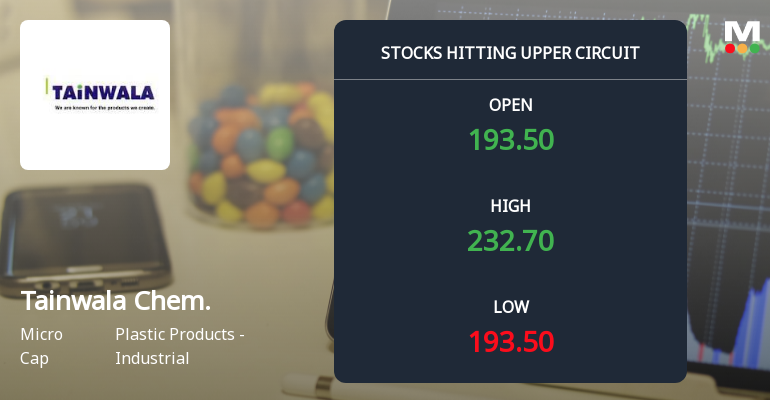
Tainwala Chemicals & Plastics Locks at Upper Circuit With 20% Gain — Buyers Queue, Sellers Absent
At Rs 232, the buying was done — not because demand dried up, but because the exchange wouldn't let the stock go any higher. Tainwala Chemicals & Plastics (India) Ltd locked at its upper circuit of 20% on 13 Jul 2026, with buyers queuing and no sellers willing to part with shares.
Read full news article
Tainwala Chemicals & Plastics (India) Ltd is Rated Sell
Tainwala Chemicals & Plastics (India) Ltd is rated 'Sell' by MarketsMOJO. This rating was last updated on 09 June 2026, reflecting a reassessment of the stock’s outlook. However, all fundamentals, returns, and financial metrics discussed here are current as of 05 July 2026, providing investors with the latest perspective on the company’s position.
Read full news article
Tainwala Chemicals & Plastics (India) Ltd is Rated Sell
Tainwala Chemicals & Plastics (India) Ltd is rated 'Sell' by MarketsMOJO. This rating was last updated on 09 June 2026, reflecting a change from a previous 'Strong Sell' grade. However, all fundamentals, returns, and financial metrics discussed here are current as of 23 June 2026, providing investors with an up-to-date assessment of the stock's position.
Read full news article Announcements
Compliances-Certificate under Reg. 74 (5) of SEBI (DP) Regulations 2018
07-Jul-2026 | Source : BSEIn compliance with Regulation 74(5) of the SEBI (DP) Regulations 2018 we furnish herewith a Certificate dated 01st July 2026 issued by MUFG Intime India Private Limited (Formerly known as Link Intime India Private Limited) the RTA of the Company for the quarter ended 30th June 2026.
Announcement under Regulation 30 (LODR)-Newspaper Publication
29-Jun-2026 | Source : BSENotice to Shareholders in connection with another Special Window for Re-lodgment of Physical Share Transfers and Intimation to shareholders holding shares in physical mode for updating their details with the Companys Registrar and Share Transfer Agent.
Closure of Trading Window
19-Jun-2026 | Source : BSEPursuant to the Companys Code of Conduct to Regulate Monitor and Report Trading in Securities by Insiders of the Company provisions of SEBI (Prohibition of Insider Trading) Regulations 2015 and further to NSE Letter/BSE Circulars The Trading Window for dealing in securities of the Company for all Insiders Designated Persons (including their immediate relatives) will remain closed from Wednesday 1st July 2026 till the expiry of 48 hours after the declaration of Unaudited Financial Results of the Company for the quarter ended 30th June 2026.
Corporate Actions

No Upcoming Board Meetings

Tainwala Chemicals & Plastics (India) Ltd has declared 30% dividend, ex-date: 11 Aug 25

No Splits history available

No Bonus history available

No Rights history available
Quality key factors
Valuation key factors
Technicals key factors
 Technical Indicator Scale: Bearish, Mildly Bearish, Sideways, Mildly Bullish, Bullish Turned
 Shareholding Snapshot : Mar 2026
Shareholding Compare (%holding)
Promoters
None
Held by 9 Schemes (0.17%)
Held by 0 FIIs (0.04%)
Ramesh Tainwala (31.31%)
Ayush Ramesh Tainwala (2.32%)
22.38%
Quarterly Results Snapshot (Standalone) - Mar'26 - YoY

YoY Growth in quarter ended Mar 2026 is -74.95% vs 572.15% in Mar 2025
YoY Growth in quarter ended Mar 2026 is 29.09% vs 225.00% in Mar 2025
Half Yearly Results Snapshot (Standalone) - Sep'25
Growth in half year ended Sep 2025 is -60.90% vs 151.84% in Mar 2025

Growth in half year ended Sep 2025 is 35.98% vs 17.14% in Mar 2025
Nine Monthly Results Snapshot (Standalone) - Dec'25
YoY Growth in nine months ended Dec 2025 is 48.51% vs -35.56% in Dec 2024
YoY Growth in nine months ended Dec 2025 is 131.19% vs -17.11% in Dec 2024
Annual Results Snapshot (Standalone) - Mar'26
YoY Growth in year ended Mar 2026 is 8.59% vs -8.93% in Mar 2025
YoY Growth in year ended Mar 2026 is 119.31% vs 2.29% in Mar 2025
About Tainwala Chemicals & Plastics (India) Ltd

Company Coordinates


