
Compare Cheviot Company with Similar Stocks
Dashboard
Poor long term growth as Net Sales has grown by an annual rate of 6.70% and Operating profit at 7.10% over the last 5 years
- PAT(Latest six months) At Rs 8.15 cr has Grown at -36.08%
- ROCE(HY) Lowest at 9.80%
- PBT LESS OI(Q) At Rs 15.13 cr has Fallen at -19.31%
Despite the size of the company, domestic mutual funds hold only 0.01% of the company
Stock DNA
Paper, Forest & Jute Products
INR 657 Cr (Micro Cap)
13.00
25
0.45%
-0.03
7.32%
0.93
Total Returns (Price + Dividend) 
Latest dividend: 5 per share ex-dividend date: Jul-31-2025
Risk Adjusted Returns v/s
Returns Beta

News
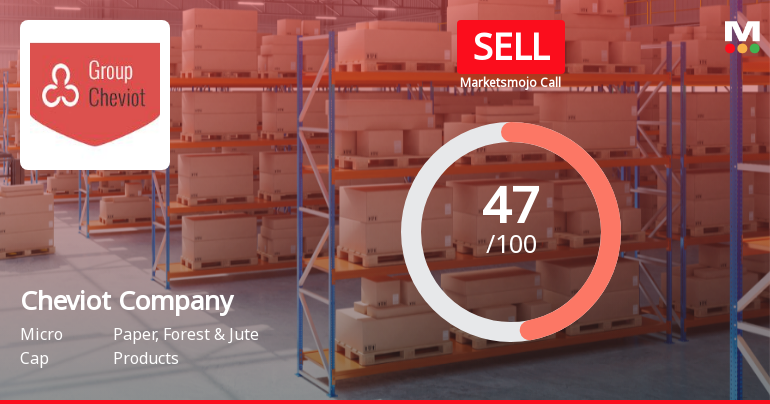
Cheviot Company Ltd Downgraded to Sell Amid Valuation and Financial Concerns
Cheviot Company Ltd, a micro-cap player in the Paper, Forest & Jute Products sector, has seen its investment rating downgraded from Hold to Sell by MarketsMOJO as of 23 June 2026. The revision reflects a deterioration in valuation metrics, financial trends, and technical indicators, despite the company’s net-debt-free status and fair valuation relative to peers.
Read full news article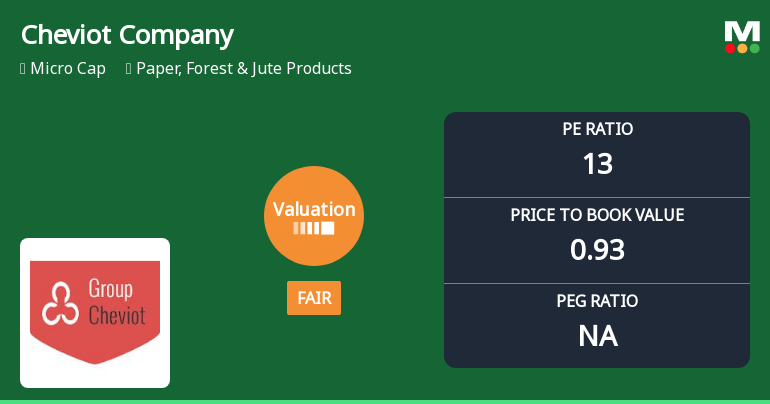
Cheviot Company Ltd Valuation Shifts Signal Changing Market Sentiment
Cheviot Company Ltd, a micro-cap player in the Paper, Forest & Jute Products sector, has seen its valuation parameters shift from attractive to fair, prompting a downgrade in its Mojo Grade from Hold to Sell. This article analyses the recent changes in key valuation metrics, compares them with industry peers, and assesses the implications for investors amid a mixed performance backdrop.
Read full news article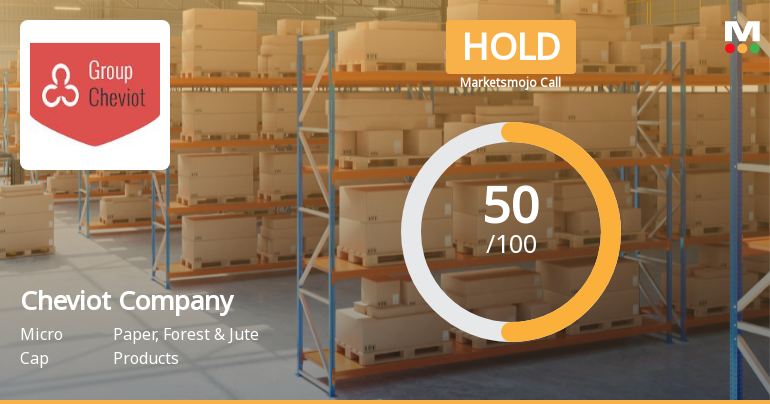
Cheviot Company Ltd Upgraded to Hold as Valuation Improves Amid Mixed Financial Trends
Cheviot Company Ltd, a micro-cap player in the Paper, Forest & Jute Products sector, has seen its investment rating upgraded from Sell to Hold as of 15 June 2026. This change reflects a reassessment across four key parameters: quality, valuation, financial trend, and technicals, with valuation improvements playing a pivotal role in the revised outlook.
Read full news article Announcements
Announcement under Regulation 30 (LODR)-Newspaper Publication
10-Jun-2026 | Source : BSENotice to shareholders published on 10th June 2026 inter alia informing that the 128th AGM scheduled to be held on Thursday 6th August 2026 at 11:00 a.m. (IST) through VC/OAVM and the manner in which shareholders can register their email ID / Bank mandate with the Company.
Announcement under Regulation 30 (LODR)-Date of payment of Dividend
21-May-2026 | Source : BSEDividend as recommended by the Board of Directors if declared at the ensuing AGM will be paid on and from 11th August 2026 subject to deduction of tax at source wherever applicable.
Corporate Actions

No Upcoming Board Meetings

Cheviot Company Ltd has declared 250% dividend, ex-date: 30 Jul 26

No Splits history available

Cheviot Company Ltd has announced 1:2 bonus issue, ex-date: 29 Aug 18

No Rights history available
Quality key factors
Valuation key factors
Technicals key factors
 Technical Indicator Scale: Bearish, Mildly Bearish, Sideways, Mildly Bullish, Bullish Turned
 Shareholding Snapshot : Mar 2026
Shareholding Compare (%holding)
Promoters
None
Held by 1 Schemes (0.0%)
Held by 12 FIIs (0.28%)
Harsh Investments Private Limited (70.61%)
None
19.16%
Quarterly Results Snapshot (Standalone) - Mar'26 - YoY

YoY Growth in quarter ended Mar 2026 is 5.10% vs 8.91% in Mar 2025
YoY Growth in quarter ended Mar 2026 is -197.21% vs -37.64% in Mar 2025
Half Yearly Results Snapshot (Standalone) - Sep'25

Growth in half year ended Sep 2025 is 35.62% vs -18.21% in Sep 2024
Growth in half year ended Sep 2025 is -3.20% vs 23.13% in Sep 2024
Nine Monthly Results Snapshot (Standalone) - Dec'25
YoY Growth in nine months ended Dec 2025 is 33.10% vs -10.10% in Dec 2024
YoY Growth in nine months ended Dec 2025 is 25.44% vs -11.07% in Dec 2024
Annual Results Snapshot (Standalone) - Mar'26
YoY Growth in year ended Mar 2026 is 24.57% vs -5.05% in Mar 2025
YoY Growth in year ended Mar 2026 is -10.48% vs -16.79% in Mar 2025
About Cheviot Company Ltd

Company Coordinates


