
Compare Ramco Inds. with Similar Stocks
Dashboard
Company has a Debt to Equity ratio (avg) of 0.03 times
Poor long term growth as Net Sales has grown by an annual rate of 8.11% and Operating profit at 4.00% over the last 5 years
The company has declared Positive results for the last 4 consecutive quarters
With ROE of 6.6, it has a Attractive valuation with a 0.6 Price to Book Value
Majority shareholders : Promoters
Market Beating performance in long term as well as near term
Total Returns (Price + Dividend) 
Latest dividend: 1 per share ex-dividend date: Aug-06-2025
Risk Adjusted Returns v/s
Returns Beta

News

Ramco Industries Ltd Downgraded to Hold Amid Mixed Technical and Valuation Signals
Ramco Industries Ltd, a small-cap player in the miscellaneous sector, has seen its investment rating downgraded from Buy to Hold as of 31 July 2026. This revision reflects a nuanced assessment across four key parameters: quality, valuation, financial trend, and technical indicators. While the company continues to demonstrate solid financial performance and market-beating returns over the medium term, emerging technical signals and valuation considerations have tempered enthusiasm among analysts.
Read full news article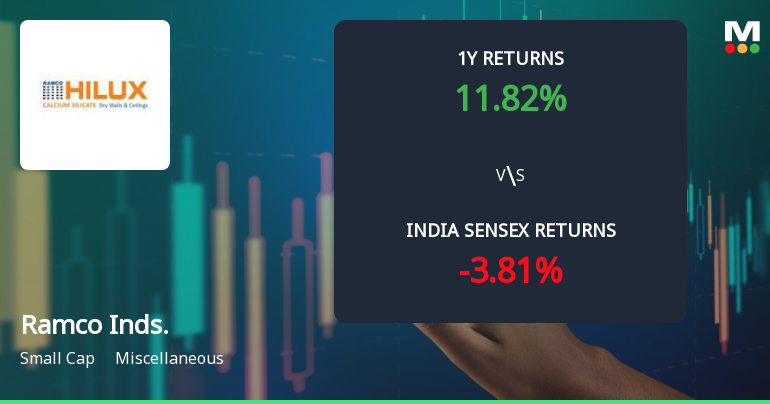
Ramco Industries Ltd Technical Momentum Shifts Amid Mixed Market Signals
Ramco Industries Ltd has experienced a nuanced shift in its technical momentum, with key indicators signalling a transition from a strongly bullish stance to a more tempered mildly bullish outlook. This change reflects a complex interplay of momentum oscillators and moving averages, suggesting cautious optimism for investors amid mixed signals across weekly and monthly timeframes.
Read full news article
Ramco Industries Ltd is Rated Buy
Ramco Industries Ltd is rated 'Buy' by MarketsMOJO, with this rating last updated on 16 July 2026. However, the analysis and financial metrics discussed here reflect the stock's current position as of 28 July 2026, providing investors with the latest insights into its performance and outlook.
Read full news article Announcements
Announcement under Regulation 30 (LODR)-Newspaper Publication
29-Jul-2026 | Source : BSENotice to Shareholders - Copy of Newspaper Publication
General Updates - 61St AGM
28-Jul-2026 | Source : BSE61st AGM - Physical communication to shareholders
General Updates - 61St AGM
28-Jul-2026 | Source : BSE61st AGM - Communication sent to Shareholders whose e-mail IDs are registered.
Corporate Actions

10 Aug 2026

Ramco Industries Ltd has declared 125% dividend, ex-date: 13 Aug 26

Ramco Industries Ltd has announced 1:10 stock split, ex-date: 14 Sep 09

Ramco Industries Ltd has announced 1:1 bonus issue, ex-date: 14 Sep 09

No Rights history available
Quality key factors
Valuation key factors
Technicals key factors
 Technical Indicator Scale: Bearish, Mildly Bearish, Sideways, Mildly Bullish, Bullish Turned
 Shareholding Snapshot : Jun 2026
Shareholding Compare (%holding)
Promoters
1.0501
Held by 2 Schemes (2.63%)
Held by 28 FIIs (1.0%)
Pusapadi Ramasubramania Raja Venketrama Raja (16.71%)
Govindlal M Parikh (7.62%)
34.77%
Quarterly Results Snapshot (Consolidated) - Mar'26 - YoY

YoY Growth in quarter ended Mar 2026 is 18.74% vs 15.81% in Mar 2025
YoY Growth in quarter ended Mar 2026 is 145.39% vs -18.49% in Mar 2025
Half Yearly Results Snapshot (Consolidated) - Sep'25

Growth in half year ended Sep 2025 is -0.45% vs 11.65% in Sep 2024
Growth in half year ended Sep 2025 is 89.31% vs 58.92% in Sep 2024
Nine Monthly Results Snapshot (Consolidated) - Dec'25
YoY Growth in nine months ended Dec 2025 is 3.54% vs 9.12% in Dec 2024
YoY Growth in nine months ended Dec 2025 is 50.59% vs 134.92% in Dec 2024
Annual Results Snapshot (Consolidated) - Mar'26
YoY Growth in year ended Mar 2026 is 7.06% vs 11.51% in Mar 2025
YoY Growth in year ended Mar 2026 is 69.29% vs 71.12% in Mar 2025
About Ramco Industries Ltd

Company Coordinates


