
Compare Hariyana Ship with Similar Stocks
Dashboard
With a Operating Losses, the company has a Weak Long Term Fundamental Strength
- Company's ability to service its debt is weak with a poor EBIT to Interest (avg) ratio of -0.22
- The company has been able to generate a Return on Equity (avg) of 3.35% signifying low profitability per unit of shareholders funds
Risky - Negative Operating Profits
Below par performance in long term as well as near term
Total Returns (Price + Dividend) 
Latest dividend: 3.5 per share ex-dividend date: Sep-18-2013
Risk Adjusted Returns v/s
Returns Beta

News

Hariyana Ship Breakers Ltd is Rated Strong Sell
Hariyana Ship Breakers Ltd is rated Strong Sell by MarketsMOJO, with this rating last updated on 14 Nov 2025. However, the analysis and financial metrics discussed here reflect the stock’s current position as of 29 June 2026, providing investors with an up-to-date view of the company’s fundamentals, valuation, financial trend, and technical outlook.
Read full news article
Hariyana Ship Breakers Ltd is Rated Strong Sell
Hariyana Ship Breakers Ltd is rated Strong Sell by MarketsMOJO, with this rating last updated on 14 Nov 2025. However, the analysis and financial metrics presented here reflect the stock’s current position as of 17 June 2026, providing investors with the latest insights into the company’s performance and outlook.
Read full news article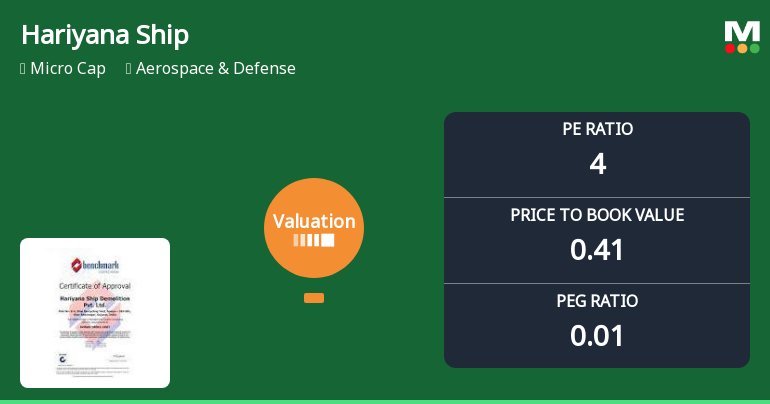
Hariyana Ship Breakers Ltd Valuation Shifts Signal Elevated Risk Amid Market Pressure
Hariyana Ship Breakers Ltd, operating within the Aerospace & Defense sector, has experienced a notable shift in its valuation parameters, moving from a previously ungraded status to a strong sell recommendation. This change reflects a significant reassessment of its price attractiveness, with key valuation metrics such as the price-to-earnings (P/E) and price-to-book value (P/BV) ratios now indicating heightened risk compared to both historical levels and peer averages.
Read full news article Announcements
Closure of Trading Window
25-Jun-2026 | Source : BSEPursuant to SEBI (Prohibition of Insider Trading) Regulations 2015 and in accordance with code of conduct for Trading in Listed or proposed to be Listed Securities of the Company Please note that the Trading Window for dealing in securities of the Company shall remain closed for all Designated Persons w.e.f. Wednesday July 01 2026. The Trading Window shall open 48 hours after the Companys Unaudited Standalone and Consolidated Financial Results for the quarter ended June 30 2026 becomes generally available.
Clarification On Non-Compliance With Regulation 33 Of SEBI (LODR) Regulations 2015 For The Period Ended March 31 2026
15-Jun-2026 | Source : BSEEnclosed herewith are the Clarification Letter and the revised Audit Report for the period ended March 31 2026 received from the Statutory Auditor for your reference and records.
Financial Results For Quarter And Year Ended 31St March 2026.
29-May-2026 | Source : BSEEnclosed Standalone and Consolidated Financial Results for the quarter and year ended 31st March 2026.
Corporate Actions

No Upcoming Board Meetings

Hariyana Ship Breakers Ltd has declared 35% dividend, ex-date: 18 Sep 13

No Splits history available

No Bonus history available

No Rights history available
Quality key factors
Valuation key factors
Technicals key factors
 Technical Indicator Scale: Bearish, Mildly Bearish, Sideways, Mildly Bullish, Bullish Turned
 Shareholding Snapshot : Mar 2026
Shareholding Compare (%holding)
Promoters
None
Held by 0 Schemes
Held by 0 FIIs
Rajeev Shantisarup Reniwal (24.96%)
Sangeetha S (1.78%)
21.67%
Quarterly Results Snapshot (Consolidated) - Mar'26 - QoQ

QoQ Growth in quarter ended Mar 2026 is -100.00% vs 69.23% in Dec 2025
QoQ Growth in quarter ended Mar 2026 is -237.24% vs 203.11% in Dec 2025
Half Yearly Results Snapshot (Consolidated) - Sep'25

Growth in half year ended Sep 2025 is 490.91% vs -99.85% in Sep 2024
Growth in half year ended Sep 2025 is 306.94% vs -70.61% in Sep 2024
Nine Monthly Results Snapshot (Consolidated) - Dec'25
YoY Growth in nine months ended Dec 2025 is 1,490.91% vs -99.85% in Dec 2024
YoY Growth in nine months ended Dec 2025 is 755.26% vs -64.26% in Dec 2024
Annual Results Snapshot (Consolidated) - Mar'26
YoY Growth in year ended Mar 2026 is 1,490.91% vs -99.85% in Mar 2025
YoY Growth in year ended Mar 2026 is -75.62% vs -50.46% in Mar 2025
About Hariyana Ship Breakers Ltd

Company Coordinates


