
Compare Modern Dairies with Similar Stocks
Total Returns (Price + Dividend) 
Modern Dairies for the last several years.
Risk Adjusted Returns v/s
Returns Beta

News
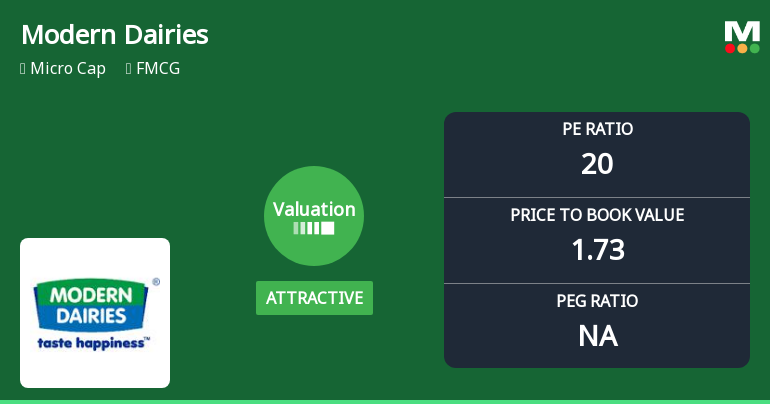
Modern Dairies Ltd Valuation Shifts Signal Renewed Price Attractiveness Amid Mixed Returns
Modern Dairies Ltd has seen a notable shift in its valuation parameters, moving from a fair to an attractive rating, despite recent underperformance relative to the Sensex. With a current price of ₹33.77 and a micro-cap market classification, the company’s price-to-earnings (P/E) and price-to-book value (P/BV) ratios suggest a more compelling entry point for investors seeking value in the FMCG sector.
Read full news article
Modern Dairies Ltd Downgraded to Strong Sell Amid Weak Financials and Bearish Technicals
Modern Dairies Ltd, a micro-cap player in the FMCG sector, has seen its investment rating downgraded from Sell to Strong Sell as of 19 June 2026. This revision reflects deteriorating technical indicators, disappointing financial trends, and valuation concerns, despite the company’s strong management efficiency. The stock has underperformed the broader market significantly over the past year, prompting a reassessment of its outlook.
Read full news article
Modern Dairies Ltd Upgraded to Sell on Valuation and Financial Trends
Modern Dairies Ltd has seen its investment rating upgraded from Strong Sell to Sell, driven primarily by a shift in valuation metrics despite ongoing challenges in financial performance and market returns. The revised rating reflects a nuanced assessment across quality, valuation, financial trends, and technical indicators, signalling cautious optimism amid persistent headwinds.
Read full news article Announcements
Report On The Requests For Re-Lodgement Of Transfer Of Physical Shares
08-Jun-2026 | Source : BSEReport on the requests received in May 2026 from shareholders for re-lodgement of transfer of physical shares under the special window.
Compliances-Reg.24(A)-Annual Secretarial Compliance
29-May-2026 | Source : BSEAnnual Secretarial Compliance Report for the Financial Year ended on 31 March 2026
Announcement under Regulation 30 (LODR)-Newspaper Publication
23-May-2026 | Source : BSEDisclosure of Newspaper Publications of Audited Financial Results for the Quarter and Financial Year ended on 31st March 2026
Corporate Actions

No Upcoming Board Meetings

No Dividend history available

No Splits history available

Modern Dairies Ltd has announced 1:1 bonus issue, ex-date: 28 Sep 07

No Rights history available
Quality key factors
Valuation key factors
Technicals key factors
 Technical Indicator Scale: Bearish, Mildly Bearish, Sideways, Mildly Bullish, Bullish Turned
 Shareholding Snapshot : Mar 2026
Shareholding Compare (%holding)
Promoters
None
Held by 5 Schemes (0.03%)
Held by 0 FIIs
Krishan Kumar Goyal (14.07%)
Laven Kumar Goyal (2.33%)
40.15%
Quarterly Results Snapshot (Standalone) - Mar'26 - QoQ

QoQ Growth in quarter ended Mar 2026 is 5.37% vs 6.73% in Dec 2025
QoQ Growth in quarter ended Mar 2026 is -73.77% vs -27.81% in Dec 2025
Half Yearly Results Snapshot (Standalone) - Sep'25
Growth in half year ended Sep 2025 is -4.76% vs 3.30% in Sep 2024

Growth in half year ended Sep 2025 is -53.48% vs -69.26% in Sep 2024
Nine Monthly Results Snapshot (Standalone) - Dec'25
YoY Growth in nine months ended Dec 2025 is -3.61% vs -2.04% in Dec 2024
YoY Growth in nine months ended Dec 2025 is -93.00% vs 133.54% in Dec 2024
Annual Results Snapshot (Standalone) - Mar'26
YoY Growth in year ended Mar 2026 is -2.35% vs -3.71% in Mar 2025
YoY Growth in year ended Mar 2026 is -94.12% vs 142.36% in Mar 2025
About Modern Dairies Ltd

Company Coordinates


