
Compare Welspun Corp with Similar Stocks
Dashboard
Company has a Debt to Equity ratio (avg) of 0.07 times
Healthy long term growth as Net Sales has grown by an annual rate of 21.10% and Operating profit at 27.73%
With ROE of 17.6, it has a Fair valuation with a 4.4 Price to Book Value
High Institutional Holdings at 32.72%
Consistent Returns over the last 3 years
Stock DNA
Iron & Steel Products
INR 38,718 Cr (Small Cap)
25.00
25
0.66%
-0.16
17.62%
4.35
Total Returns (Price + Dividend) 
Latest dividend: 5.0289543348775645 per share ex-dividend date: Jun-30-2026
Risk Adjusted Returns v/s
Returns Beta

News

Broad-Based Technical Strength Lifts Welspun Corp Ltd. to 52-Week High of Rs 1540.85
Surging past its previous peaks, Welspun Corp Ltd. touched a new 52-week high of Rs 1540.85 on 1 Jul 2026, marking a remarkable 65.56% gain over the past year. This milestone comes amid a backdrop of strong technical momentum and sustained outperformance against the broader market.
Read full news article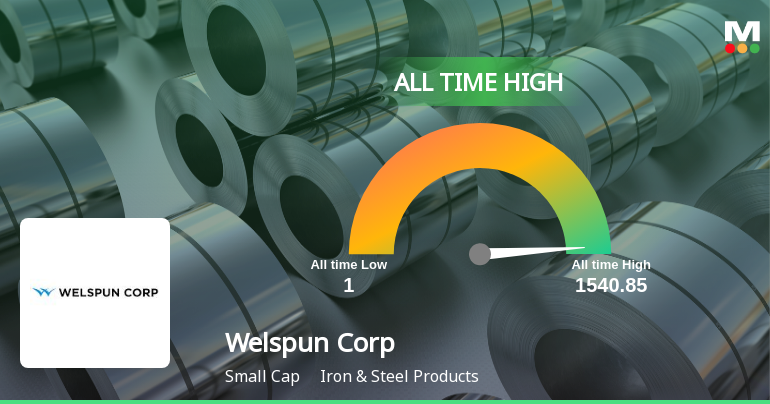
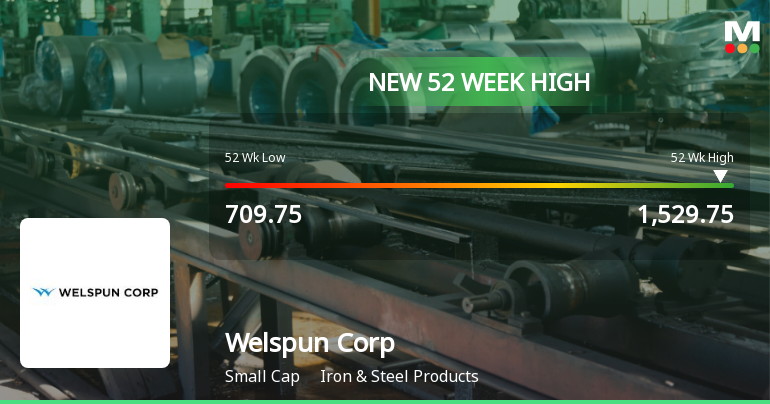
Broad-Based Technical Strength Lifts Welspun Corp Ltd. to 52-Week High of Rs 1529.75
Surging to a fresh 52-week and all-time high of Rs 1,529.75 on 30 Jun 2026, Welspun Corp Ltd. has demonstrated remarkable price momentum, outpacing the broader market with a 62.18% gain over the past year against the Sensex’s decline of 8.53%. This milestone caps a sustained rally driven predominantly by robust technical signals across multiple timeframes.
Read full news article Announcements
Closure of Trading Window
25-Jun-2026 | Source : BSEIntimation of Closure of Trading Window
Announcement under Regulation 30 (LODR)-Newspaper Publication
24-Jun-2026 | Source : BSENewspaper Advertisement regarding the 31st Annual General Meeting of the Company
Physical Letter To Shareholders
23-Jun-2026 | Source : BSEPhysical Letter to Shareholders
Corporate Actions

No Upcoming Board Meetings

Welspun Corp Ltd. has declared 100% dividend, ex-date: 30 Jun 26

No Splits history available

No Bonus history available

No Rights history available
Quality key factors
Valuation key factors
Technicals key factors
 Technical Indicator Scale: Bearish, Mildly Bearish, Sideways, Mildly Bullish, Bullish Turned
 Shareholding Snapshot : Mar 2026
Shareholding Compare (%holding)
Promoters
None
Held by 25 Schemes (9.86%)
Held by 180 FIIs (11.23%)
Balkrishan Goenka, Trustee Of Welspun Group Master Trust (44.55%)
Authum Investment And Infrastructure Limited (6.45%)
11.48%
Quarterly Results Snapshot (Consolidated) - Mar'26 - YoY

YoY Growth in quarter ended Mar 2026 is 9.87% vs -12.02% in Mar 2025

YoY Growth in quarter ended Mar 2026 is -46.96% vs 160.72% in Mar 2025
Half Yearly Results Snapshot (Consolidated) - Sep'25
Growth in half year ended Sep 2025 is 23.08% vs -20.79% in Sep 2024
Growth in half year ended Sep 2025 is 47.65% vs -2.71% in Sep 2024
Nine Monthly Results Snapshot (Consolidated) - Dec'25
YoY Growth in nine months ended Dec 2025 is 23.92% vs -21.94% in Dec 2024
YoY Growth in nine months ended Dec 2025 is 2.72% vs 43.70% in Dec 2024
Annual Results Snapshot (Consolidated) - Mar'26
YoY Growth in year ended Mar 2026 is 19.98% vs -19.39% in Mar 2025
YoY Growth in year ended Mar 2026 is -15.46% vs 71.84% in Mar 2025
About Welspun Corp Ltd.

Company Coordinates


