Zen Technologies

  • Market Cap: Small Cap
  • Industry: Aerospace & Defense
  • ISIN: INE251B01027
  • NSEID: ZENTEC
  • BSEID: 533339
INR
1,981.75
117.7 (6.31%)
BSENSE

Aug 18, 04:01 PM

BSE+NSE Vol: 29.1 lacs

  • Price Points
  • Score
  • Mojo Parameters
  • Total Return
  • News and Corporate Actions
  • Key factors
  • Shareholding
  • Financials
  • CompanyCV
stock-summaryPrice Point
High/Low

1Day

52 Week

Valuation
Technical
Day's Volume

CASH

29.1 lacs (439.10%) Volume

Shareholding (Jun 2026)

FII

6.46%

Held by 95 FIIs

DII

10.42%

Held by 11 DIIs

Promoter

48.51%

Why is Zen Technologies Ltd falling/rising?

18-Aug-2026

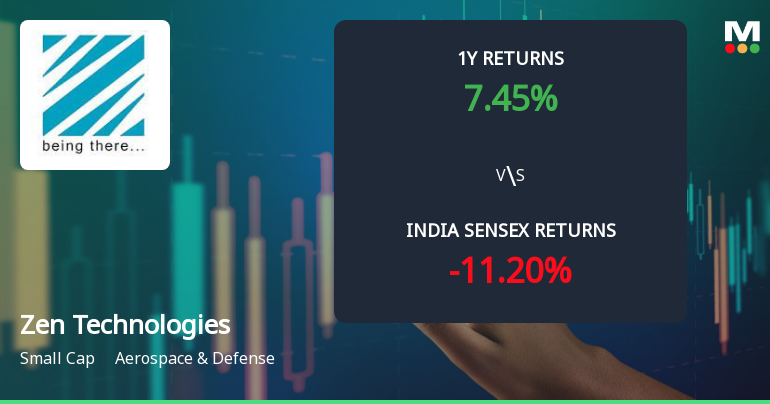
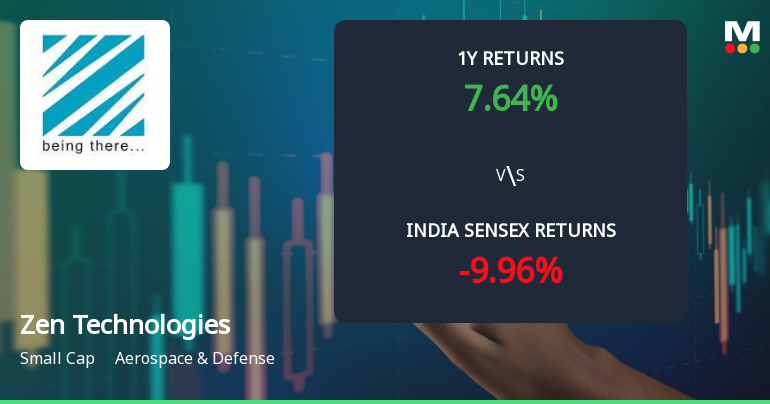
As of 17-Aug, Zen Technologies Ltd's stock price has risen to 1,864.05, reflecting a 0.3% increase, driven by strong performance metrics and increased investor interest. The stock has outperformed the Sensex and shows consistent gains, supported by positive long-term growth indicators and rising institutional investment.

As of 17-Aug, Zen Technologies Ltd is experiencing a rise in its stock price, currently at 1,864.05, reflecting a change of 5.65 (0.3%) upward. This increase can be attributed to several positive factors. Over the past week, the stock has gained 8.23%, significantly outperforming the Sensex, which has declined by 1.04% during the same period. Additionally, the stock has shown consistent performance, with gains over the last five days and an intraday high of Rs 1896, marking a 2.02% increase.<BR><BR>The stock is also trading above its 5-day, 20-day, 50-day, 100-day, and 200-day moving averages, indicating a strong upward trend. Investor participation has risen, with a delivery volume increase of 0.49% compared to the 5-day average, suggesting growing interest in the stock. Furthermore, Zen Technologies is net-debt free and has demonstrated healthy long-term growth, with net sales increasing at an annual rate of 61.85% and operating profit growing at 129.03%. <BR><BR>Institutional investors have also increased their stake by 0.82% in the previous quarter, now holding 16.88% of the company, which typically indicates confidence in the company's fundamentals. Despite some negative results in terms of earnings per share and profit after tax in recent quarters, the stock's performance over the last year has been strong, generating a return of 32.54%. Overall, these factors contribute to the rising stock price of Zen Technologies Ltd.

View full answer

Which are the latest news on Zen Technologies?

18-Aug-2026

Who are in the management team of Zen Technologies?

14-Aug-2026

The management team of Zen Technologies includes Ashok Atluri (Chairman & Managing Director), M Ravi Kumar, Shilpa Choudari (Whole-time Directors), Kishore Dutt Atluri (Joint Managing Director), and several Independent Directors: Amreek Singh Sandhu, R K Tyagi, Ajay Kumar Singh, and Sirisha Chintapalli, along with Raghavendra Prasad Movva as Company Secretary & Compliance Officer. They oversee the company's operations and strategic direction.

The management team of Zen Technologies includes the following individuals:<BR><BR>1. **Ashok Atluri** - Chairman & Managing Director<BR>2. **M Ravi Kumar** - Whole-time Director<BR>3. **Shilpa Choudari** - Whole-time Director<BR>4. **Kishore Dutt Atluri** - Joint Managing Director<BR>5. **Amreek Singh Sandhu** - Independent Director<BR>6. **R K Tyagi** - Independent Director<BR>7. **Ajay Kumar Singh** - Independent Director<BR>8. **Sirisha Chintapalli** - Independent Director<BR>9. **Raghavendra Prasad Movva** - Company Secretary & Compliance Officer<BR><BR>This team is responsible for overseeing the company's operations and strategic direction.

View full answer

What does Zen Technologies do?

14-Aug-2026

Zen Technologies Ltd develops advanced simulators for weapons and defense equipment in the Aerospace & Defense sector. As of June 2026, it reported net sales of 142 Cr and a net profit of 34 Cr, with a market cap of INR 16,730 Cr.

Overview: <BR>Zen Technologies Ltd develops state-of-the-art simulators for weapons and allied defense equipment, operating within the Aerospace & Defense industry and classified as a Small Cap company.<BR><BR>History: <BR>Zen Technologies was incorporated in 1993. The latest quarterly results reported net sales and profit for June 2026.<BR><BR>Financial Snapshot: <BR>Net Sales: 142 Cr (Quarterly Results - Jun 2026) <BR>Net Profit: 34 Cr (Quarterly Results - Jun 2026) <BR>Market Cap: INR 16,730 Cr (Small Cap)<BR><BR>Key Metrics: <BR>P/E: 91.00 <BR>Industry P/E: 22 <BR>Dividend Yield: 0.11% <BR>Debt-Equity: -0.18 <BR>Return on Equity: 10.20% <BR>Price to Book: 8.72<BR><BR>Contact Details: <BR>Address: B-42 Industrial Estate, Sanathnagar Hyderabad Telangana : 500018 <BR>Tel: 91-40-23813281/23812894 <BR>Email: info@zentechnologies.com <BR>Website: http://www.zentechnologies.com

View full answer

Who are the peers of the Zen Technologies?

14-Aug-2026

Zen Technologies' peers include Bharat Dynamics, Cochin Shipyard, and MTAR Technologie, among others. In terms of management risk, growth, and capital structure, Zen Technologies shows good performance, with a 1-year return of 28.78%, significantly lower than MTAR Technologie's 393.78%.

Peers: The peers of Zen Technologies are Bharat Dynamics, Cochin Shipyard, Garden Reach Sh., Data Pattern, MTAR Technologie, Astra Microwave, Apollo Micro Sys, Swan Defence, Sigma Advanced S, and Paras Defence.<BR><BR>Quality Snapshot: Excellent management risk is observed at Garden Reach Sh., while Good management risk is found at Bharat Dynamics, Cochin Shipyard, Data Pattern, Zen Technologies, and Astra Microwave. Average management risk is present at MTAR Technologie and Apollo Micro Sys, while Below Average management risk is noted at Swan Defence and Sigma Advanced S. In terms of Growth, Excellent growth is seen at Zen Technologies, Garden Reach Sh., and Apollo Micro Sys, while Good growth is observed at MTAR Technologie, Average growth at Data Pattern and Astra Microwave, and Below Average growth at Bharat Dynamics, Cochin Shipyard, Swan Defence, and Sigma Advanced S. For Capital Structure, Excellent capital structure is noted at Bharat Dynamics, Cochin Shipyard, Data Pattern, and Zen Technologies, while Good capital structure is seen at MTAR Technologie and Astra Microwave, Average at Apollo Micro Sys, and Below Average at Swan Defence and Sigma Advanced S.<BR><BR>Return Snapshot: The peer with the highest 1-year return is MTAR Technologie at 393.78%, while the lowest is Bharat Dynamics at -13.71%. Zen Technologies has a 1-year return of 28.78%, which is positive compared to Bharat Dynamics but significantly lower than MTAR Technologie. Additionally, Swan Defence has no available six-month return data.

View full answer

How big is Zen Technologies?

14-Aug-2026

As of 14th August, Zen Technologies Ltd has a market capitalization of 16,784.98 Cr and reported net sales of 671.11 Cr and net profit of 180.16 Cr over the latest four quarters.

As of 14th August, <BR><BR>Market Cap: Zen Technologies Ltd has a market capitalization of 16,784.98 Cr, classified as Small Cap.<BR><BR>Recent Quarterly Performance: The sum of Net Sales for the latest 4 quarters is 671.11 Cr, while the sum of Net Profit for the same period is 180.16 Cr.<BR><BR>Balance Sheet Snapshot: The reporting period is March 2026, with Shareholder's Funds amounting to 1,889.06 Cr and Total Assets valued at 2,152.80 Cr.

View full answer

Should I buy, sell or hold Zen Technologies Ltd?

28-Jul-2026

Are Zen Technologies Ltd latest results good or bad?

26-Jul-2026

Zen Technologies Ltd's latest Q1 FY27 results show a mixed performance: while net profit increased by 9.29% sequentially to ₹34.46 crores, it fell 27.83% year-on-year, and revenue dropped 20.46% from the previous quarter, indicating significant challenges ahead. Investors should be cautious due to declining sales and compressed margins.

Zen Technologies Ltd's latest results for Q1 FY27 present a mixed picture. On one hand, the company reported a net profit of ₹34.46 crores, which is a 9.29% increase from the previous quarter. However, this figure represents a significant 27.83% decline year-on-year. <BR><BR>In terms of revenue, the company experienced a notable contraction, with sales dropping to ₹141.64 crores, marking a 20.46% decrease from the previous quarter and a 10.48% decline compared to the same quarter last year. This is the lowest revenue recorded in the past seven quarters, indicating potential execution challenges.<BR><BR>Moreover, the operating margin has also compressed to 27.34%, the lowest level in recent times, which raises concerns about the company's operational efficiency. The profit after tax (PAT) margin decreased to 22.49%, down 403 basis points from the previous quarter.<BR><BR>While the increase in net profit may seem positive, it was largely supported by non-operating income, which accounted for a significant portion of the profit before tax. This reliance on non-operating income raises questions about the sustainability of the company's profitability moving forward.<BR><BR>Overall, the results indicate that while there are some positive aspects, such as sequential profit growth, the substantial revenue decline and margin compression suggest that Zen Technologies is facing significant challenges that need to be addressed. Investors may want to approach with caution, monitoring how the company navigates these issues in the upcoming quarters.

View full answer

Is Zen Technologies technically bullish or bearish?

17-Nov-2025

As of November 14, 2025, Zen Technologies exhibits a mildly bearish trend, supported by bearish indicators from the MACD, moving averages, and Bollinger Bands, despite a mildly bullish KST signal.

As of 14 November 2025, the technical trend for Zen Technologies has changed from bearish to mildly bearish. The current stance is mildly bearish, primarily driven by the weekly MACD indicating bearish momentum and the daily moving averages also showing a bearish trend. The Bollinger Bands on both weekly and monthly time frames are also mildly bearish, further supporting this view. While the KST shows a mildly bullish signal on the weekly chart, it is offset by the overall bearish indicators. The absence of clear signals from the RSI and OBV suggests a lack of strong momentum in either direction. Overall, the technical outlook remains cautiously negative.

View full answer

How has been the historical performance of Zen Technologies?

13-Nov-2025

Zen Technologies has experienced significant financial growth, with net sales rising from 54.64 Cr in Mar'21 to 973.64 Cr in Mar'25, and profit after tax increasing from 2.77 Cr to 299.38 Cr during the same period. Total assets also surged from 202.75 Cr to 2,044.58 Cr, reflecting robust performance across key metrics.

Answer:<BR>The historical performance of Zen Technologies shows significant growth in net sales, with figures rising from 54.64 Cr in Mar'21 to 973.64 Cr in Mar'25. The total operating income followed a similar upward trend, reaching 973.64 Cr in Mar'25, compared to just 54.64 Cr in Mar'21. Operating profit, excluding other income, also increased substantially, from 7.38 Cr in Mar'21 to 373.52 Cr in Mar'25. Profit before tax saw a remarkable rise from 4.36 Cr in Mar'21 to 406.12 Cr in Mar'25, while profit after tax grew from 2.77 Cr in Mar'21 to 299.38 Cr in Mar'25. The earnings per share (EPS) reflected this growth, increasing from 0.39 in Mar'21 to 31.03 in Mar'25. <BR><BR>On the balance sheet, total assets surged from 202.75 Cr in Mar'21 to 2,044.58 Cr in Mar'25, driven by increases in cash and bank balances, which rose from 40.28 Cr to 965.78 Cr over the same period. Total liabilities also increased, from 202.75 Cr in Mar'21 to 2,044.58 Cr in Mar'25, primarily due to long-term borrowings that rose to 40.20 Cr in Mar'25. The company maintained a positive cash flow from financing activities, which reached 1,006.00 Cr in Mar'25, contributing to a net cash inflow of 37.00 Cr for the year. Overall, Zen Technologies has demonstrated robust growth across key financial metrics over the past several years.<BR><BR>Breakdown:<BR>Zen Technologies has exhibited impressive growth in its financial performance over the years. Net sales increased dramatically from 54.64 Cr in Mar'21 to 973.64 Cr in Mar'25, indicating a strong upward trajectory in revenue generation. The total operating income mirrored this trend, reaching 973.64 Cr in Mar'25. Operating profit, excluding other income, surged from 7.38 Cr in Mar'21 to 373.52 Cr in Mar'25, showcasing enhanced operational efficiency. Profit before tax escalated from 4.36 Cr in Mar'21 to 406.12 Cr in Mar'25, while profit after tax rose significantly from 2.77 Cr to 299.38 Cr in the same period. The earnings per share (EPS) also reflected this growth, climbing from 0.39 to 31.03. <BR><BR>On the balance sheet, total assets grew from 202.75 Cr in Mar'21 to 2,044.58 Cr by Mar'25, driven largely by an increase in cash and bank balances from 40.28 Cr to 965.78 Cr. Total liabilities rose correspondingly, from 202.75 Cr to 2,044.58 Cr, with long-term borrowings reaching 40.20 Cr. The company reported a positive cash flow from financing activities of 1,006.00 Cr in Mar'25, contributing to a net cash inflow of 37.00 Cr for the year. Overall, Zen Technologies has shown robust growth across its key financial metrics, indicating a strong performance trajectory.

View full answer

Who are the top shareholders of the Zen Technologies?

17-Jul-2025

The top shareholders of Zen Technologies include Ashok Atluri with 21.65%, mutual funds at 7.7%, foreign institutional investors at 5.95%, and individual investors collectively holding 29.41%. The highest public shareholder is the Motilal Oswal Focused Fund with 3.8%.

The top shareholders of Zen Technologies include the promoters, with Ashok Atluri holding the highest stake at 21.65%. The company has no pledged promoter holdings. Additionally, mutual funds hold 7.7% of the shares through 14 schemes, while foreign institutional investors (FIIs) own 5.95% through 111 different entities. The highest public shareholder is the Motilal Oswal Focused Fund, which holds 3.8%. Individual investors collectively hold 29.41% of the shares.

View full answer

Is Zen Technologies overvalued or undervalued?

09-Jun-2025

Zen Technologies is currently considered overvalued with a PE ratio of 67.14 and other high valuation metrics, despite a strong 107.75% return over the past year, indicating a significant shift in market perception from risky to very expensive.

As of 1 August 2022, Zen Technologies' valuation grade has moved from risky to very expensive, indicating a significant shift in its market perception. The company is currently considered overvalued, with a PE ratio of 67.14, an EV to EBITDA of 47.95, and a Price to Book Value of 11.06. These ratios are substantially higher than its peers, such as TCS with a PE of 25.23 and Infosys at 24.32, highlighting the premium investors are paying for Zen Technologies relative to the industry.<BR><BR>In addition to its high valuation ratios, Zen Technologies has a PEG ratio of 0.63, suggesting that while growth expectations may be strong, the current price does not reflect a favorable risk-adjusted return. The company has experienced a notable return of 107.75% over the past year, significantly outperforming the Sensex's 7.63% return, which may contribute to the inflated valuation. Overall, the combination of high valuation metrics and peer comparisons supports the conclusion that Zen Technologies is overvalued in the current market environment.

View full answer

When is the next results date for Zen Technologies?

06-Jun-2025

No Upcoming Board Meetings

Has Zen Technologies declared dividend?

06-Jun-2025

Zen Technologies Ltd has declared a 100% dividend, amounting to ₹1 per share, with an ex-date of September 6, 2024. The company has demonstrated strong total returns over various periods, with a 5-year total return of 4826.87%.

Zen Technologies Ltd has declared a 100% dividend.<BR><BR>Dividend Details:<BR>- Percentage announced: 100%<BR>- Amount per share: 1 per share<BR>- Ex-date: 06 Sep 24<BR><BR>Dividend Yield: 0.05%.<BR><BR>Total Returns by Period:<BR>In the last 6 months, the price return was 9.29%, with a dividend return of 0%, resulting in a total return of 9.29%.<BR><BR>Over the past year, the price return was 128.05%, with a dividend return of 0.10%, leading to a total return of 128.15%.<BR><BR>In the 2-year period, the price return reached 403.87%, with a dividend return of 0.29%, culminating in a total return of 404.16%.<BR><BR>For the 3-year period, the price return was 983.77%, with a dividend return of 0.77%, resulting in a total return of 984.54%.<BR><BR>In the last 4 years, the price return was 2837.53%, with a dividend return of 1.54%, leading to a total return of 2839.07%.<BR><BR>Over the past 5 years, the price return was 4823.56%, with a dividend return of 3.31%, culminating in a total return of 4826.87%.<BR><BR>Overall, Zen Technologies has declared a significant dividend and has shown impressive total returns across all periods, indicating strong performance in both price appreciation and dividend distribution.

View full answer
iScoreScore
Click here to find our call on this stock
Strong Sell
Sell
Hold
Buy
Strong Buy

Dashboard

1

With a fall in EPS of -28.75%, the company declared Very Negative results in Jun 26

  • The company has declared negative results for the last 5 consecutive quarters
  • The company has declared negative results in Jun 25 after 13 consecutive negative quarters
  • PAT(Q) At Rs 36.83 cr has Fallen at -23.6% (vs previous 4Q average)
  • ROCE(HY) Lowest at 16.04%
  • NET SALES(Q) At Rs 141.64 cr has Fallen at -17.6% (vs previous 4Q average)
2

With ROE of 10.2, it has a Very Expensive valuation with a 8.9 Price to Book Value

stock-summaryMojo Parameters

Mojo Parameters

Loading Valuation Snapshot...

Stock DNA

stock-summary
Industry

Aerospace & Defense

stock-summary
Market cap

INR 17,145 Cr (Small Cap)

stock-summary
P/E

93.00

stock-summary
Industry P/E

19

stock-summary
Dividend Yield

0.00%

stock-summary
Debt Equity

-0.18

stock-summary
Return on Equity

10.20%

stock-summary
Price to Book

8.91

Revenue and Profits:
Net Sales:
142 Cr
(Quarterly Results - Jun 2026)
Net Profit:
34 Cr
stock-summaryTotal Returns
Total Returns (Price + Dividend) stock-summary
Dividend Yield (0%)
TimePeriod
Price Return
Dividend Return
Total Return
3 Months
27.53%
0.06%
27.59%
6 Months
48.65%
0.08%
48.73%
1 Year
38.54%
0.06%
38.6%
2 Years
16.4%
0.22%
16.62%
3 Years
135.99%
0.51%
136.5%
4 Years
950.49%
1.99%
952.48%
5 Years
2300.67%
2.00%
2302.67%

Latest dividend: 2 per share ex-dividend date: Aug-14-2025

Risk Adjusted Returns v/s stock-summary
Returns Beta
Icon
Beta has not been calculated since enough price history is not available
stock-summaryNews & Corporate Actions

Announcements stock-summary

Announcement under Regulation 30 (LODR)-Analyst / Investor Meet - Intimation

14-Aug-2026 | Source : BSE

Intimation of Schedule of Analyst / Institutional Investor Meeting

Announcement under Regulation 30 (LODR)-Analyst / Investor Meet - Intimation

14-Aug-2026 | Source : BSE

Intimation of Schedule of Analyst / Institutional Investor Meeting

Announcement under Regulation 30 (LODR)-Analyst / Investor Meet - Intimation

14-Aug-2026 | Source : BSE

Intimation of Schedule of Analyst / Institutional Investor Meeting

Corporate Actions stock-summary

stock-summary
BOARD MEETING

No Upcoming Board Meetings

stock-summary
DIVIDEND

Zen Technologies Ltd has declared 100% dividend, ex-date: 21 Aug 26

stock-summary
SPLITS

Zen Technologies Ltd has announced 1:10 stock split, ex-date: 21 Nov 14

stock-summary
BONUS

No Bonus history available

stock-summary
RIGHTS

No Rights history available

stock-summaryKey Factors

Quality key factors stock-summary

Factor
Value
Sales Growth (5y)
61.85%
EBIT Growth (5y)
129.03%
EBIT to Interest (avg)
30.99
Debt to EBITDA (avg)
0.56
Net Debt to Equity (avg)
-0.18
Sales to Capital Employed (avg)
0.54
Tax Ratio
25.97%
Dividend Payout Ratio
6.44%
Pledged Shares
0
Institutional Holding
16.88%
ROCE (avg)
31.48%
ROE (avg)
13.65%

Valuation key factors

Factor
Value
P/E Ratio
93
Industry P/E
19
Price to Book Value
8.91
EV to EBIT
84.43
EV to EBITDA
74.55
EV to Capital Employed
10.62
EV to Sales
24.58
PEG Ratio
NA
Dividend Yield
NA
ROCE (Latest)
14.35%
ROE (Latest)
10.20%

Technicals key factors

Indicator
Weekly
Monthly
MACD
Mildly Bearish
Bullish
RSI
No Signal
No Signal
Bollinger Bands
Bullish
Bullish
Moving Averages
Bullish (Daily)
KST
Mildly Bearish
Mildly Bearish
Dow Theory
Mildly Bullish
No Trend
OBV
No Trend
No Trend
stock-summary Technical Indicator Scale: Bearish, Mildly Bearish, Sideways, Mildly Bullish, Bullish  Turned 
stock-summaryShareholding
Shareholding Snapshot : Jun 2026stock-summary
Shareholding Compare (%holding) stock-summary
Majority shareholders

Promoters

Pledged Promoter Holdings

None

Mutual Funds

Held by 21 Schemes (7.55%)

FIIs

Held by 95 FIIs (6.46%)

Promoter with highest holding

Ashok Atluri (21.65%)

Highest Public shareholder

Motilal Oswal Nifty 500 Etf (6.53%)

Individual Investors Holdings

28.65%

stock-summaryFinancial
[
  {
    "link": "quarterly",
    "btn_text": "All Quarterly Results",
    "header": "Quarterly Results Snapshot (Consolidated) - Jun'26 - QoQ",
    "rhs": [
      {
        "prefix": "Net Sales ",
        "suffix": "QoQ Growth in quarter ended Jun 2026 is -20.46% vs 0.15% in Mar 2026",
        "dir": -1
      },
      {
        "prefix": "Consolidated Net Profit ",
        "suffix": "QoQ Growth in quarter ended Jun 2026 is 9.29% vs -42.43% in Mar 2026",
        "dir": 1
      }
    ],
    "table": {
      "header": [
        "Jun'26",
        "Mar'26",
        "Change(%)"
      ],
      "body": [
        {
          "field": "Net Sales",
          "val1": "141.64",
          "val2": "178.08",
          "chgp": "-20.46%",
          "chgp_class": "negative"
        },
        {
          "field": "Operating Profit (PBDIT) excl Other Income",
          "val1": "38.73",
          "val2": "50.99",
          "chgp": "-24.04%",
          "chgp_class": "negative"
        },
        {
          "field": "Interest",
          "val1": "1.09",
          "val2": "2.02",
          "chgp": "-46.04%",
          "chgp_class": "positive"
        },
        {
          "field": "Exceptional Items",
          "val1": "-3.37",
          "val2": "0.00",
          "chgp": "",
          "chgp_class": "neutral"
        },
        {
          "field": "Consolidate Net Profit",
          "val1": "34.46",
          "val2": "31.53",
          "chgp": "9.29%",
          "chgp_class": "positive"
        },
        {
          "field": "Operating Profit Margin (Excl OI)",
          "val1": "27.34%",
          "val2": "28.63%",
          "chgp": "-1.29%",
          "chgp_class": "negative"
        }
      ]
    }
  },
  {
    "link": "half-yearly",
    "btn_text": "All Half Yearly Results",
    "header": "Half Yearly Results Snapshot (Consolidated) - Sep'25",
    "rhs": [
      {
        "prefix": "Net Sales ",
        "suffix": " Growth in half year ended Sep 2025 is -33.17% vs 149.54% in Sep 2024",
        "dir": -1
      },
      {
        "prefix": "Consolidated Net Profit ",
        "suffix": " Growth in half year ended Sep 2025 is -23.18% vs 123.67% in Sep 2024",
        "dir": -1
      }
    ],
    "table": {
      "header": [
        "Sep'25",
        "Sep'24",
        "Change(%)"
      ],
      "body": [
        {
          "field": "Net Sales",
          "val1": "331.79",
          "val2": "496.46",
          "chgp": "-33.17%",
          "chgp_class": "negative"
        },
        {
          "field": "Operating Profit (PBDIT) excl Other Income",
          "val1": "129.45",
          "val2": "191.35",
          "chgp": "-32.35%",
          "chgp_class": "negative"
        },
        {
          "field": "Interest",
          "val1": "5.50",
          "val2": "3.46",
          "chgp": "58.96%",
          "chgp_class": "negative"
        },
        {
          "field": "Exceptional Items",
          "val1": "0.94",
          "val2": "0.00",
          "chgp": "",
          "chgp_class": "neutral"
        },
        {
          "field": "Consolidate Net Profit",
          "val1": "107.15",
          "val2": "139.48",
          "chgp": "-23.18%",
          "chgp_class": "negative"
        },
        {
          "field": "Operating Profit Margin (Excl OI)",
          "val1": "39.02%",
          "val2": "38.54%",
          "chgp": "0.48%",
          "chgp_class": "positive"
        }
      ]
    }
  },
  {
    "link": "nine-monthly",
    "btn_text": "All Nine Monthly Results",
    "header": "Nine Monthly Results Snapshot (Consolidated) - Dec'25",
    "rhs": [
      {
        "prefix": "Net Sales ",
        "suffix": "YoY Growth in nine months ended Dec 2025 is -21.44% vs 117.33% in Dec 2024",
        "dir": -1
      },
      {
        "prefix": "Consolidated Net Profit ",
        "suffix": "YoY Growth in nine months ended Dec 2025 is -9.64% vs 92.81% in Dec 2024",
        "dir": -1
      }
    ],
    "table": {
      "header": [
        "Dec'25",
        "Dec'24",
        "Change(%)"
      ],
      "body": [
        {
          "field": "Net Sales",
          "val1": "509.61",
          "val2": "648.67",
          "chgp": "-21.44%",
          "chgp_class": "negative"
        },
        {
          "field": "Operating Profit (PBDIT) excl Other Income",
          "val1": "196.25",
          "val2": "235.55",
          "chgp": "-16.68%",
          "chgp_class": "negative"
        },
        {
          "field": "Interest",
          "val1": "8.25",
          "val2": "6.42",
          "chgp": "28.50%",
          "chgp_class": "negative"
        },
        {
          "field": "Exceptional Items",
          "val1": "0.94",
          "val2": "0.00",
          "chgp": "",
          "chgp_class": "neutral"
        },
        {
          "field": "Consolidate Net Profit",
          "val1": "161.92",
          "val2": "179.20",
          "chgp": "-9.64%",
          "chgp_class": "negative"
        },
        {
          "field": "Operating Profit Margin (Excl OI)",
          "val1": "38.51%",
          "val2": "36.31%",
          "chgp": "2.20%",
          "chgp_class": "positive"
        }
      ]
    }
  },
  {
    "link": "annual",
    "btn_text": "All Annual Results",
    "header": "Annual Results Snapshot (Consolidated) - Mar'26",
    "rhs": [
      {
        "prefix": "Net Sales ",
        "suffix": "YoY Growth in year ended Mar 2026 is -29.37% vs 121.36% in Mar 2025",
        "dir": -1
      },
      {
        "prefix": "Consolidated Net Profit ",
        "suffix": "YoY Growth in year ended Mar 2026 is -30.97% vs 119.14% in Mar 2025",
        "dir": -1
      }
    ],
    "table": {
      "header": [
        "Mar'26",
        "Mar'25",
        "Change(%)"
      ],
      "body": [
        {
          "field": "Net Sales",
          "val1": "687.69",
          "val2": "973.64",
          "chgp": "-29.37%",
          "chgp_class": "negative"
        },
        {
          "field": "Operating Profit (PBDIT) excl Other Income",
          "val1": "247.24",
          "val2": "373.52",
          "chgp": "-33.81%",
          "chgp_class": "negative"
        },
        {
          "field": "Interest",
          "val1": "10.27",
          "val2": "10.38",
          "chgp": "-1.06%",
          "chgp_class": "positive"
        },
        {
          "field": "Exceptional Items",
          "val1": "0.94",
          "val2": "0.00",
          "chgp": "",
          "chgp_class": "neutral"
        },
        {
          "field": "Consolidate Net Profit",
          "val1": "193.45",
          "val2": "280.24",
          "chgp": "-30.97%",
          "chgp_class": "negative"
        },
        {
          "field": "Operating Profit Margin (Excl OI)",
          "val1": "35.95%",
          "val2": "38.36%",
          "chgp": "-2.41%",
          "chgp_class": "negative"
        }
      ]
    }
  }
]

Quarterly Results Snapshot (Consolidated) - Jun'26 - QoQstock-summary

Jun'26
Mar'26
Change(%)
Net Sales
141.64
178.08
-20.46%
Operating Profit (PBDIT) excl Other Income
38.73
50.99
-24.04%
Interest
1.09
2.02
-46.04%
Exceptional Items
-3.37
0.00
Consolidate Net Profit
34.46
31.53
9.29%
Operating Profit Margin (Excl OI)
27.34%
28.63%
-1.29%
Values in Rs Cr.
Direction Arrows
Net Sales

QoQ Growth in quarter ended Jun 2026 is -20.46% vs 0.15% in Mar 2026

Direction Arrows
Consolidated Net Profit

QoQ Growth in quarter ended Jun 2026 is 9.29% vs -42.43% in Mar 2026

Half Yearly Results Snapshot (Consolidated) - Sep'25stock-summary

Sep'25
Sep'24
Change(%)
Net Sales
331.79
496.46
-33.17%
Operating Profit (PBDIT) excl Other Income
129.45
191.35
-32.35%
Interest
5.50
3.46
58.96%
Exceptional Items
0.94
0.00
Consolidate Net Profit
107.15
139.48
-23.18%
Operating Profit Margin (Excl OI)
39.02%
38.54%
0.48%
Values in Rs Cr.
Direction Arrows
Net Sales

Growth in half year ended Sep 2025 is -33.17% vs 149.54% in Sep 2024

Direction Arrows
Consolidated Net Profit

Growth in half year ended Sep 2025 is -23.18% vs 123.67% in Sep 2024

Nine Monthly Results Snapshot (Consolidated) - Dec'25stock-summary

Dec'25
Dec'24
Change(%)
Net Sales
509.61
648.67
-21.44%
Operating Profit (PBDIT) excl Other Income
196.25
235.55
-16.68%
Interest
8.25
6.42
28.50%
Exceptional Items
0.94
0.00
Consolidate Net Profit
161.92
179.20
-9.64%
Operating Profit Margin (Excl OI)
38.51%
36.31%
2.20%
Values in Rs Cr.
Direction Arrows
Net Sales

YoY Growth in nine months ended Dec 2025 is -21.44% vs 117.33% in Dec 2024

Direction Arrows
Consolidated Net Profit

YoY Growth in nine months ended Dec 2025 is -9.64% vs 92.81% in Dec 2024

Annual Results Snapshot (Consolidated) - Mar'26stock-summary

Mar'26
Mar'25
Change(%)
Net Sales
687.69
973.64
-29.37%
Operating Profit (PBDIT) excl Other Income
247.24
373.52
-33.81%
Interest
10.27
10.38
-1.06%
Exceptional Items
0.94
0.00
Consolidate Net Profit
193.45
280.24
-30.97%
Operating Profit Margin (Excl OI)
35.95%
38.36%
-2.41%
Values in Rs Cr.
Direction Arrows
Net Sales

YoY Growth in year ended Mar 2026 is -29.37% vs 121.36% in Mar 2025

Direction Arrows
Consolidated Net Profit

YoY Growth in year ended Mar 2026 is -30.97% vs 119.14% in Mar 2025

stock-summaryCompany CV
About Zen Technologies Ltd stock-summary
stock-summary
Zen Technologies Ltd
Small Cap
Aerospace & Defense
Zen Technologies Limited was incorporated in 1993. The Company was established with the main object of developing state-of-the-art simulators for weapons and allied defense equipment. Over the year, the Company has developed skills in designing, developing and manufacturing various types of state-of-the-art simulators.
Company Coordinates stock-summary
Company Details
B-42 Industrial Estate, Sanathnagar Hyderabad Telangana : 500018
stock-summary
Tel: 91-40-23813281/23812894
stock-summary
info@zentechnologies.com
Registrar Details
Karvy Computershare Pvt Ltd, Plot No 17-24 , Near Image Hospital,, Reliance Cybervilae,Vithalrao Nagar,, Madhapur, Hyderabad