Data Pattern

  • Market Cap: Small Cap
  • Industry: Aerospace & Defense
  • ISIN: INE0IX101010
  • NSEID: DATAPATTNS
  • BSEID: 543428
INR
3,765.00
130.5 (3.59%)
BSENSE

May 20

BSE+NSE Vol: 5.34 lacs

  • Price Points
  • Score
  • Mojo Parameters
  • Total Return
  • News and Corporate Actions
  • Key factors
  • Shareholding
  • Financials
  • CompanyCV
stock-summaryPrice Point
High/Low

1Day

52 Week

Valuation
Technical
Day's Volume

CASH

5.34 lacs (-22.35%) Volume

Shareholding (Mar 2026)

FII

12.48%

Held by 147 FIIs

DII

11.68%

Held by 18 DIIs

Promoter

42.41%

What does Data Pattern do?

06-Jun-2025

Data Patterns (India) Ltd is a Mid Cap company in the Aerospace & Defense sector, reporting net sales of ₹396 Cr and a net profit of ₹114 Cr for March 2025. The company, originally founded in 1998, became publicly listed in 2021 and has a market cap of ₹17,242 Cr.

Overview:<BR>Data Patterns (India) Ltd operates in the Aerospace & Defense industry and is categorized as a Mid Cap company.<BR><BR>History:<BR>The company was incorporated in 1998 as 'Indus Teqsite Private Limited' and underwent a name change to Data Patterns (India) Private Limited following a merger on August 4, 2021. It converted to a Public Limited Company on August 12, 2021, and was renamed Data Patterns (India) Limited on September 13, 2021. The latest reported quarterly results show net sales and profit for March 2025.<BR><BR>Financial Snapshot:<BR>Most recent Net Sales: 396 Cr (Quarterly Results - Mar 2025) <BR>Most recent Net Profit: 114 Cr (Quarterly Results - Mar 2025) <BR>Market-cap value: Rs 17,242 Cr (Mid Cap)<BR><BR>Key Metrics:<BR>P/E: 80.00 <BR>Industry P/E: 29 <BR>Dividend Yield: 0.21% <BR>Debt Equity: -0.30 <BR>Return on Equity: 14.71% <BR>Price to Book: 11.77 <BR><BR>Contact Details:<BR>No Company Details Available <BR>Registrar Address: Not available.

View full answer

Who are in the management team of Data Pattern?

06-Jun-2025

As of March 2023, the management team of Data Pattern includes Mathew Cyriac (Nominee), Srinivasagopalan Rangarajan (Managing Director), Rekha Murthy Rangarajan (Whole-time Director), Vijay Ananth K (Executive Director), and several Independent Directors: Sastry Venkata Rama Vadlamani, S Ramakrishnan, Prasad R Menon, and Anuradha Sharma. This team brings a diverse range of expertise to the company.

As of March 2023, the management team of Data Pattern includes the following individuals:<BR><BR>1. Mathew Cyriac - Nominee<BR>2. Sastry Venkata Rama Vadlamani - Independent Director<BR>3. S Ramakrishnan - Independent Director<BR>4. Prasad R Menon - Independent Director<BR>5. Srinivasagopalan Rangarajan - Managing Director<BR>6. Rekha Murthy Rangarajan - Whole-time Director<BR>7. Vijay Ananth K - Executive Director<BR>8. Anuradha Sharma - Independent Director<BR><BR>These members bring a diverse range of expertise and leadership to the company.

View full answer

Has Data Pattern declared dividend?

06-Jun-2025

Data Patterns (India) Ltd has declared a 325% dividend, amounting to ₹6.5 per share, with an ex-date of July 23, 2024. The dividend yield is 0.21%, and while recent total returns have been strong, the yield remains relatively low.

Data Patterns (India) Ltd has declared a 325% dividend.<BR><BR>Dividend Details:<BR>- Percentage announced: 325%<BR>- Amount per share: 6.5<BR>- Ex-date: 23 Jul 24<BR><BR>Dividend Yield: 0.21%.<BR><BR>Total Returns by Period:<BR>In the last 6 months, the price return was 18.63%, the dividend return was 0%, resulting in a total return of 18.63%.<BR><BR>Over the past year, the price return was 17.76%, the dividend return was 0.24%, leading to a total return of 18.0%.<BR><BR>In the last 2 years, the price return was 71.42%, the dividend return was 0.57%, which resulted in a total return of 71.99%.<BR><BR>For the 3-year period, the price return was 310.2%, the dividend return was 2.26%, culminating in a total return of 312.46%.<BR><BR>In the last 4 years, there was no price return, no dividend return, and thus a total return of 0.0%.<BR><BR>Over the past 5 years, there was also no price return, no dividend return, resulting in a total return of 0.0%.<BR><BR>Overall, Data Patterns (India) Ltd has declared a significant dividend, and while the recent total returns show strong performance, particularly over the longer term, the dividend yield remains relatively low.

View full answer

Who are the peers of the Data Pattern?

03-Jun-2025

Data Pattern's peers include Hind.Aeronautics, Bharat Electron, Mazagon Dock, Bharat Dynamics, Cochin Shipyard, Astra Microwave, Mishra Dhatu Nig, Paras Defence, and Unimech Aero, with varying management and growth risks. Mazagon Dock leads in 1-year returns at 112.09%, while Data Pattern has a 0.25% return, higher than Mishra Dhatu Nig's -5.87%.

Peers: The peers of Data Pattern are Hind.Aeronautics, Bharat Electron, Mazagon Dock, Bharat Dynamics, Cochin Shipyard, Astra Microwave, Mishra Dhatu Nig, Paras Defence, and Unimech Aero.<BR><BR>Quality Snapshot: Excellent management risk is observed at Hind.Aeronautics, Bharat Electron, and Mazagon Dock, while Good management risk is found at Data Pattern, Bharat Dynamics, Astra Microwave, Mishra Dhatu Nig, Unimech Aero, and the rest. Below Average management risk is noted for Paras Defence. In terms of Growth, Excellent growth is seen at Hind.Aeronautics, Bharat Electron, and Mazagon Dock, while Good growth is observed at Data Pattern, Astra Microwave, and the rest. Below Average growth is present at Bharat Dynamics, Cochin Shipyard, and Mishra Dhatu Nig, with Average growth at Paras Defence. Excellent capital structure is noted for Hind.Aeronautics, Bharat Electron, Mazagon Dock, Bharat Dynamics, Cochin Shipyard, and Paras Defence, while Good capital structure is seen at Astra Microwave, Mishra Dhatu Nig, and Unimech Aero.<BR><BR>Return Snapshot: The peer with the highest 1-year return is Mazagon Dock at 112.09%, while Mishra Dhatu Nig has the lowest at -5.87%. Data Pattern's 1-year return of 0.25% is higher than Mishra Dhatu Nig's but significantly lower than Mazagon Dock's. Additionally, Mishra Dhatu Nig is the only peer with a negative six-month return.

View full answer

Is Data Pattern overvalued or undervalued?

09-Jun-2025

As of December 29, 2021, Data Pattern is considered very expensive with a PE ratio of 77.27 and other high valuation metrics, indicating it is overvalued compared to peers like Tata Consultancy Services and Infosys, despite strong returns.

As of 29 December 2021, the valuation grade for Data Pattern has moved from does not qualify to very expensive. The company is currently overvalued, with a PE ratio of 77.27, a Price to Book Value of 11.36, and an EV to EBITDA of 60.70. These ratios significantly exceed those of its peers, such as Tata Consultancy Services Ltd., which has a PE of 25.23, and Infosys Ltd., with a PE of 24.32, indicating that Data Pattern's valuation is not justified relative to its industry counterparts.<BR><BR>In addition to the high valuation ratios, Data Pattern's PEG ratio stands at 3.50, further emphasizing its expensive valuation compared to peers like HCL Technologies Ltd., which has a PEG of 2.37. While the company has shown strong returns, outperforming the Sensex over various periods, the current valuation metrics suggest that investors may be paying a premium that is not supported by the underlying financial performance.

View full answer

Who are the top shareholders of the Data Pattern?

17-Jul-2025

The top shareholders of Data Pattern include promoter Rangarajan S with 22.8%, institutional investors with 5.73% from 21 mutual fund schemes and 12.75% from 79 foreign institutional investors, the Government of Singapore at 5.3%, and individual investors holding 29.78%.

The top shareholders of Data Pattern include the promoters, who hold the majority of the shares. The promoter with the highest holding is Rangarajan S, with a stake of 22.8%. Additionally, institutional investors are represented by 21 mutual fund schemes, which collectively hold 5.73%, and 79 foreign institutional investors (FIIs) holding 12.75%. The highest public shareholder is the Government of Singapore, with a holding of 5.3%. Individual investors collectively own 29.78% of the company.

View full answer

How big is Data Pattern?

24-Jul-2025

As of 24th July, Data Patterns (India) Ltd has a market capitalization of 15,614.00 Cr, with recent Net Sales of 708.35 Cr and a Net Profit of 221.81 Cr. The company has Shareholder's Funds of 1,508.22 Cr and Total Assets of 1,839.10 Cr.

As of 24th July, Data Patterns (India) Ltd has a market capitalization of 15,614.00 Cr, categorizing it as a Mid Cap company.<BR><BR>In the latest four quarters, Data Patterns reported Net Sales of 708.35 Cr and a Net Profit of 221.81 Cr.<BR><BR>For the reporting period of March 2025, the company has Shareholder's Funds amounting to 1,508.22 Cr and Total Assets of 1,839.10 Cr.

View full answer

How has been the historical performance of Data Pattern?

01-Dec-2025

Data Pattern has shown significant financial growth from Mar'20 to Mar'25, with net sales increasing from 156.10 Cr to 708.35 Cr, and profit after tax rising from 21.05 Cr to 221.81 Cr, while maintaining a zero debt status since Mar'23. Overall, the company reflects robust growth and improved profitability.

Answer:<BR>The historical performance of Data Pattern shows significant growth in various financial metrics over the years.<BR><BR>Breakdown:<BR>Data Pattern has demonstrated a strong upward trend in net sales, increasing from 156.10 Cr in Mar'20 to 708.35 Cr in Mar'25. This growth is reflected in total operating income, which rose from 156.10 Cr in Mar'20 to 708.35 Cr in Mar'25. The company's total expenditure, excluding depreciation, also increased, reaching 433.35 Cr in Mar'25 from 112.94 Cr in Mar'20. Operating profit, excluding other income, grew from 43.16 Cr in Mar'20 to 275.00 Cr in Mar'25, while profit before tax surged from 28.43 Cr to 295.34 Cr in the same period. Profit after tax followed suit, rising from 21.05 Cr in Mar'20 to 221.81 Cr in Mar'25. The earnings per share (EPS) also improved significantly, from 22.51 in Mar'20 to 39.61 in Mar'25. On the balance sheet, total assets increased from 295.36 Cr in Mar'20 to 1,839.10 Cr in Mar'25, with total liabilities rising from 295.36 Cr to 1,839.10 Cr as well. The company has maintained a zero debt status since Mar'23, indicating a strong financial position. Overall, Data Pattern's financial performance reflects robust growth and improved profitability over the years.

View full answer

Is Data Pattern technically bullish or bearish?

02-Dec-2025

As of December 1, 2025, the trend is mildly bullish with mixed signals, indicated by a bullish weekly MACD, a bearish weekly RSI, and supportive daily moving averages, despite a mildly bearish monthly MACD.

As of 1 December 2025, the technical trend has changed from bullish to mildly bullish. The current stance is mildly bullish with moderate strength. Key indicators include a bullish MACD on the weekly timeframe, while the monthly MACD is mildly bearish. The weekly RSI is bearish, indicating some weakness, but the daily moving averages are bullish, supporting the upward trend. Bollinger Bands are mildly bullish on both weekly and monthly timeframes, suggesting potential for price stability. Overall, while there are mixed signals, the prevailing trend is mildly bullish.

View full answer

When is the next results date for Data Patterns (India) Ltd?

30-Jan-2026

The next results date for Data Patterns (India) Ltd is 05 February 2026.

The next results date for Data Patterns (India) Ltd is scheduled for 05 February 2026.

View full answer

Are Data Patterns (India) Ltd latest results good or bad?

15-May-2026

Data Patterns (India) Ltd's latest Q4 FY26 results show strong growth with a 99.19% revenue increase and a 137.35% rise in net profit, despite a 12.96% year-on-year revenue decline. While the stock dropped 3.69% post-announcement due to market volatility, the overall performance indicates positive long-term potential.

Data Patterns (India) Ltd's latest results for Q4 FY26 indicate a strong performance overall, despite some short-term volatility. The company reported a remarkable 99.19% increase in revenue quarter-on-quarter, reaching ₹344.85 crores, and a substantial net profit of ₹138.38 crores, which is up 137.35% from the previous quarter. This marks the highest operating margin recorded in the past eight quarters at 55.92%, and the profit after tax margin of 40.13% is the best in two years.<BR><BR>However, the stock faced a decline of 3.69% following the results announcement, reflecting investor reactions to the inherent volatility in project-based revenues typical in the defence sector. Year-on-year, revenue did decline by 12.96%, which could raise some concerns about consistency.<BR><BR>Despite this, Data Patterns has delivered impressive returns over the past year, outperforming the Sensex significantly. The company maintains a strong financial position with zero long-term debt, which provides it with strategic flexibility.<BR><BR>In summary, while the immediate market reaction was negative, the underlying financial results show strong growth and operational efficiency, suggesting that the overall performance can be viewed positively in the context of the company's long-term growth trajectory.

View full answer

Should I buy, sell or hold Data Patterns (India) Ltd?

16-May-2026

Why is Data Patterns (India) Ltd falling/rising?

20-May-2026

As of 19-May, Data Patterns (India) Ltd's stock price has declined to 3,634.55, down 3.2%, due to poor performance, decreasing investor participation, and high valuation compared to peers. Despite strong long-term growth, current market sentiment is negative, leading to a total decline of 13.19% over the past four days.

As of 19-May, Data Patterns (India) Ltd is experiencing a decline in its stock price, currently at 3,634.55, reflecting a change of -120.15 (-3.2%). This drop can be attributed to several factors. The stock has underperformed its sector by -5.78% today and has been on a consecutive fall for the last four days, accumulating a total decline of -13.19% during this period. <BR><BR>Additionally, the stock's performance over the past week shows a significant decrease of -10.52%, contrasting sharply with the Sensex, which has gained +0.86%. The intraday trading also indicates volatility, with the stock reaching a high of Rs 3,846.05 but falling to a low of Rs 3,622.05. The weighted average price suggests that more volume was traded closer to the low price, indicating bearish sentiment among investors.<BR><BR>Investor participation appears to be waning, as evidenced by a -26.4% drop in delivery volume compared to the five-day average. Although the company is net-debt free and has shown healthy long-term growth with a 31.33% annual increase in net sales, these positive fundamentals are overshadowed by the current market sentiment and valuation concerns. The stock is trading at a premium compared to its peers, with a Price to Book Value of 13.5, which may deter some investors.<BR><BR>In summary, the combination of recent poor performance, declining investor participation, and high valuation relative to peers are contributing to the falling stock price of Data Patterns (India) Ltd.

View full answer
iScoreScore
Click here to find our call on this stock
Strong Sell
Sell
Hold
Buy
Strong Buy

Dashboard

1

The company is Net-Debt Free

 
2

Healthy long term growth as Net Sales has grown by an annual rate of 31.33%

 
3

The company has declared Positive results for the last 3 consecutive quarters

4

High Institutional Holdings at 24.15%

5

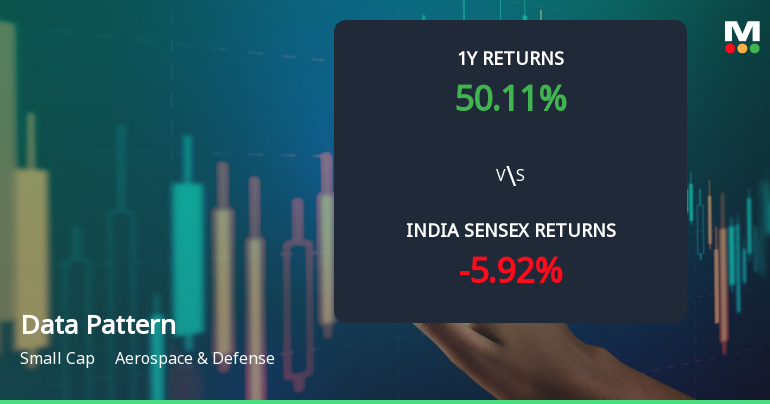
Market Beating performance in long term as well as near term

stock-summaryMojo Parameters

Mojo Parameters

Loading Valuation Snapshot...

Stock DNA

stock-summary
Industry

Aerospace & Defense

stock-summary
Market cap

INR 21,078 Cr (Small Cap)

stock-summary
P/E

75.00

stock-summary
Industry P/E

21

stock-summary
Dividend Yield

0.22%

stock-summary
Debt Equity

-0.30

stock-summary
Return on Equity

18.15%

stock-summary
Price to Book

13.52

Revenue and Profits:
Net Sales:
345 Cr
(Quarterly Results - Mar 2026)
Net Profit:
138 Cr
stock-summaryTotal Returns
Total Returns (Price + Dividend) stock-summary
Dividend Yield (0.22%)
TimePeriod
Price Return
Dividend Return
Total Return
3 Months
26.15%
0%
26.15%
6 Months
21.27%
0%
21.27%
1 Year
42.65%
0.28%
42.93%
2 Years
13.37%
0.51%
13.88%
3 Years
134.91%
1.07%
135.98%
4 Years
412.14%
3.10%
415.24%
5 Years
0%
0%
0.0%

Latest dividend: 7.9 per share ex-dividend date: Aug-01-2025

Risk Adjusted Returns v/s stock-summary
Returns Beta
Icon
Beta has not been calculated since enough price history is not available
stock-summaryNews & Corporate Actions

News

Data Patterns Falls 5.60%: Sharp Correction Amid High Volatility and Strong Q4 Results

Announcements stock-summary

Icon
No announcement available

Corporate Actions stock-summary

stock-summary
BOARD MEETING

No Upcoming Board Meetings

stock-summary
DIVIDEND

Data Patterns (India) Ltd has declared 395% dividend, ex-date: 01 Aug 25

stock-summary
SPLITS

No Splits history available

stock-summary
BONUS

No Bonus history available

stock-summary
RIGHTS

No Rights history available

stock-summaryKey Factors

Quality key factors stock-summary

Factor
Value
Sales Growth (5y)
31.33%
EBIT Growth (5y)
27.16%
EBIT to Interest (avg)
21.04
Debt to EBITDA (avg)
Net Debt is too low
Net Debt to Equity (avg)
-0.30
Sales to Capital Employed (avg)
0.45
Tax Ratio
25.35%
Dividend Payout Ratio
19.94%
Pledged Shares
0
Institutional Holding
24.15%
ROCE (avg)
28.56%
ROE (avg)
13.02%

Valuation key factors

Factor
Value
P/E Ratio
75
Industry P/E
21
Price to Book Value
13.52
EV to EBIT
56.82
EV to EBITDA
53.33
EV to Capital Employed
18.79
EV to Sales
21.57
PEG Ratio
3.18
Dividend Yield
0.22%
ROCE (Latest)
24.60%
ROE (Latest)
18.15%

Technicals key factors

Indicator
Weekly
Monthly
MACD
Bullish
Bullish
RSI
No Signal
No Signal
Bollinger Bands
Mildly Bullish
Mildly Bullish
Moving Averages
Bullish (Daily)
KST
Bullish
Bullish
Dow Theory
No Trend
Bullish
OBV
Bullish
Bullish
stock-summary Technical Indicator Scale: Bearish, Mildly Bearish, Sideways, Mildly Bullish, Bullish  Turned 
stock-summaryShareholding
Shareholding Snapshot : Mar 2026stock-summary
Shareholding Compare (%holding) stock-summary
Majority shareholders

Promoters

Pledged Promoter Holdings

None

Mutual Funds

Held by 29 Schemes (9.2%)

FIIs

Held by 147 FIIs (12.48%)

Promoter with highest holding

Rangarajan S (22.8%)

Highest Public shareholder

Desingu Rajan P (2.58%)

Individual Investors Holdings

26.66%

stock-summaryFinancial
[
  {
    "link": "quarterly",
    "btn_text": "All Quarterly Results",
    "header": "Quarterly Results Snapshot (Standalone) - Mar'26 - QoQ",
    "rhs": [
      {
        "prefix": "Net Sales ",
        "suffix": "QoQ Growth in quarter ended Mar 2026 is 99.19% vs -43.69% in Dec 2025",
        "dir": 1
      },
      {
        "prefix": "Standalone Net Profit ",
        "suffix": "QoQ Growth in quarter ended Mar 2026 is 137.36% vs 18.52% in Dec 2025",
        "dir": 1
      }
    ],
    "table": {
      "header": [
        "Mar'26",
        "Dec'25",
        "Change(%)"
      ],
      "body": [
        {
          "field": "Net Sales",
          "val1": "344.85",
          "val2": "173.13",
          "chgp": "99.19%",
          "chgp_class": "positive"
        },
        {
          "field": "Operating Profit (PBDIT) excl Other Income",
          "val1": "192.84",
          "val2": "80.59",
          "chgp": "139.29%",
          "chgp_class": "positive"
        },
        {
          "field": "Interest",
          "val1": "4.65",
          "val2": "2.20",
          "chgp": "111.36%",
          "chgp_class": "negative"
        },
        {
          "field": "Exceptional Items",
          "val1": "0.00",
          "val2": "-3.01",
          "chgp": "100.00%",
          "chgp_class": "positive"
        },
        {
          "field": "Standalone Net Profit",
          "val1": "138.38",
          "val2": "58.30",
          "chgp": "137.36%",
          "chgp_class": "positive"
        },
        {
          "field": "Operating Profit Margin (Excl OI)",
          "val1": "55.92%",
          "val2": "46.55%",
          "chgp": "9.37%",
          "chgp_class": "positive"
        }
      ]
    }
  },
  {
    "link": "half-yearly",
    "btn_text": "All Half Yearly Results",
    "header": "Half Yearly Results Snapshot (Standalone) - Sep'25",
    "rhs": [
      {
        "prefix": "Net Sales ",
        "suffix": " Growth in half year ended Sep 2025 is 108.50% vs -1.46% in Sep 2024",
        "dir": 1
      },
      {
        "prefix": "Standalone Net Profit ",
        "suffix": " Growth in half year ended Sep 2025 is 18.42% vs 5.79% in Sep 2024",
        "dir": 1
      }
    ],
    "table": {
      "header": [
        "Sep'25",
        "Sep'24",
        "Change(%)"
      ],
      "body": [
        {
          "field": "Net Sales",
          "val1": "406.79",
          "val2": "195.10",
          "chgp": "108.50%",
          "chgp_class": "positive"
        },
        {
          "field": "Operating Profit (PBDIT) excl Other Income",
          "val1": "100.56",
          "val2": "71.48",
          "chgp": "40.68%",
          "chgp_class": "positive"
        },
        {
          "field": "Interest",
          "val1": "5.60",
          "val2": "5.78",
          "chgp": "-3.11%",
          "chgp_class": "positive"
        },
        {
          "field": "Exceptional Items",
          "val1": "0.00",
          "val2": "0.00",
          "chgp": "",
          "chgp_class": "neutral"
        },
        {
          "field": "Standalone Net Profit",
          "val1": "74.69",
          "val2": "63.07",
          "chgp": "18.42%",
          "chgp_class": "positive"
        },
        {
          "field": "Operating Profit Margin (Excl OI)",
          "val1": "24.72%",
          "val2": "36.64%",
          "chgp": "-11.92%",
          "chgp_class": "negative"
        }
      ]
    }
  },
  {
    "link": "nine-monthly",
    "btn_text": "All Nine Monthly Results",
    "header": "Nine Monthly Results Snapshot (Standalone) - Dec'25",
    "rhs": [
      {
        "prefix": "Net Sales ",
        "suffix": "YoY Growth in nine months ended Dec 2025 is 85.79% vs -7.52% in Dec 2024",
        "dir": 1
      },
      {
        "prefix": "Standalone Net Profit ",
        "suffix": "YoY Growth in nine months ended Dec 2025 is 23.45% vs -2.59% in Dec 2024",
        "dir": 1
      }
    ],
    "table": {
      "header": [
        "Dec'25",
        "Dec'24",
        "Change(%)"
      ],
      "body": [
        {
          "field": "Net Sales",
          "val1": "579.92",
          "val2": "312.14",
          "chgp": "85.79%",
          "chgp_class": "positive"
        },
        {
          "field": "Operating Profit (PBDIT) excl Other Income",
          "val1": "181.15",
          "val2": "125.51",
          "chgp": "44.33%",
          "chgp_class": "positive"
        },
        {
          "field": "Interest",
          "val1": "7.80",
          "val2": "8.96",
          "chgp": "-12.95%",
          "chgp_class": "positive"
        },
        {
          "field": "Exceptional Items",
          "val1": "-3.01",
          "val2": "0.00",
          "chgp": "",
          "chgp_class": "neutral"
        },
        {
          "field": "Standalone Net Profit",
          "val1": "132.99",
          "val2": "107.73",
          "chgp": "23.45%",
          "chgp_class": "positive"
        },
        {
          "field": "Operating Profit Margin (Excl OI)",
          "val1": "31.24%",
          "val2": "40.21%",
          "chgp": "-8.97%",
          "chgp_class": "negative"
        }
      ]
    }
  },
  {
    "link": "annual",
    "btn_text": "All Annual Results",
    "header": "Annual Results Snapshot (Standalone) - Mar'26",
    "rhs": [
      {
        "prefix": "Net Sales ",
        "suffix": "YoY Growth in year ended Mar 2026 is 30.55% vs 36.27% in Mar 2025",
        "dir": -1
      },
      {
        "prefix": "Standalone Net Profit ",
        "suffix": "YoY Growth in year ended Mar 2026 is 22.34% vs 22.08% in Mar 2025",
        "dir": 1
      }
    ],
    "table": {
      "header": [
        "Mar'26",
        "Mar'25",
        "Change(%)"
      ],
      "body": [
        {
          "field": "Net Sales",
          "val1": "924.77",
          "val2": "708.35",
          "chgp": "30.55%",
          "chgp_class": "positive"
        },
        {
          "field": "Operating Profit (PBDIT) excl Other Income",
          "val1": "373.99",
          "val2": "275.00",
          "chgp": "36.00%",
          "chgp_class": "positive"
        },
        {
          "field": "Interest",
          "val1": "12.45",
          "val2": "12.08",
          "chgp": "3.06%",
          "chgp_class": "negative"
        },
        {
          "field": "Exceptional Items",
          "val1": "-3.01",
          "val2": "0.00",
          "chgp": "",
          "chgp_class": "neutral"
        },
        {
          "field": "Standalone Net Profit",
          "val1": "271.37",
          "val2": "221.81",
          "chgp": "22.34%",
          "chgp_class": "positive"
        },
        {
          "field": "Operating Profit Margin (Excl OI)",
          "val1": "40.44%",
          "val2": "38.82%",
          "chgp": "1.62%",
          "chgp_class": "positive"
        }
      ]
    }
  }
]

Quarterly Results Snapshot (Standalone) - Mar'26 - QoQstock-summary

Mar'26
Dec'25
Change(%)
Net Sales
344.85
173.13
99.19%
Operating Profit (PBDIT) excl Other Income
192.84
80.59
139.29%
Interest
4.65
2.20
111.36%
Exceptional Items
0.00
-3.01
100.00%
Standalone Net Profit
138.38
58.30
137.36%
Operating Profit Margin (Excl OI)
55.92%
46.55%
9.37%
Values in Rs Cr.
Direction Arrows
Net Sales

QoQ Growth in quarter ended Mar 2026 is 99.19% vs -43.69% in Dec 2025

Direction Arrows
Standalone Net Profit

QoQ Growth in quarter ended Mar 2026 is 137.36% vs 18.52% in Dec 2025

Half Yearly Results Snapshot (Standalone) - Sep'25stock-summary

Sep'25
Sep'24
Change(%)
Net Sales
406.79
195.10
108.50%
Operating Profit (PBDIT) excl Other Income
100.56
71.48
40.68%
Interest
5.60
5.78
-3.11%
Exceptional Items
0.00
0.00
Standalone Net Profit
74.69
63.07
18.42%
Operating Profit Margin (Excl OI)
24.72%
36.64%
-11.92%
Values in Rs Cr.
Direction Arrows
Net Sales

Growth in half year ended Sep 2025 is 108.50% vs -1.46% in Sep 2024

Direction Arrows
Standalone Net Profit

Growth in half year ended Sep 2025 is 18.42% vs 5.79% in Sep 2024

Nine Monthly Results Snapshot (Standalone) - Dec'25stock-summary

Dec'25
Dec'24
Change(%)
Net Sales
579.92
312.14
85.79%
Operating Profit (PBDIT) excl Other Income
181.15
125.51
44.33%
Interest
7.80
8.96
-12.95%
Exceptional Items
-3.01
0.00
Standalone Net Profit
132.99
107.73
23.45%
Operating Profit Margin (Excl OI)
31.24%
40.21%
-8.97%
Values in Rs Cr.
Direction Arrows
Net Sales

YoY Growth in nine months ended Dec 2025 is 85.79% vs -7.52% in Dec 2024

Direction Arrows
Standalone Net Profit

YoY Growth in nine months ended Dec 2025 is 23.45% vs -2.59% in Dec 2024

Annual Results Snapshot (Standalone) - Mar'26stock-summary

Mar'26
Mar'25
Change(%)
Net Sales
924.77
708.35
30.55%
Operating Profit (PBDIT) excl Other Income
373.99
275.00
36.00%
Interest
12.45
12.08
3.06%
Exceptional Items
-3.01
0.00
Standalone Net Profit
271.37
221.81
22.34%
Operating Profit Margin (Excl OI)
40.44%
38.82%
1.62%
Values in Rs Cr.
Direction Arrows
Net Sales

YoY Growth in year ended Mar 2026 is 30.55% vs 36.27% in Mar 2025

Direction Arrows
Standalone Net Profit

YoY Growth in year ended Mar 2026 is 22.34% vs 22.08% in Mar 2025

stock-summaryCompany CV
About Data Patterns (India) Ltd stock-summary
stock-summary
Data Patterns (India) Ltd
Small Cap
Aerospace & Defense
Data Patterns (India) Limited was formerly incorporated as 'Indus Teqsite Private Limited' on 11 November 1998 at Bangalore. Subsequent to merger with the Erstwhile Subsidiary, name of the Company was changed to Data Patterns (India) Private Limited on 04 August 2021. The Company converted into a Public Limited Company on 12 August, 2021 and consequently, its name was changed to Data Patterns (India) Limited on 13 September, 2021.
Company Coordinates stock-summary
Icon
No Company Details Available