
Compare Cochin Shipyard with Similar Stocks
Dashboard
Poor long term growth as Operating profit has grown by an annual rate 0.79% of over the last 5 years
The company has declared Negative results for the last 3 consecutive quarters
With ROE of 12.2, it has a Very Expensive valuation with a 6.3 Price to Book Value
Underperformed the market in the last 1 year
Stock DNA
Aerospace & Defense
INR 36,930 Cr (Mid Cap)
52.00
38
0.53%
-0.13
12.20%
6.30
Total Returns (Price + Dividend) 
Latest dividend: 3.5 per share ex-dividend date: Feb-03-2026
Risk Adjusted Returns v/s
Returns Beta

News
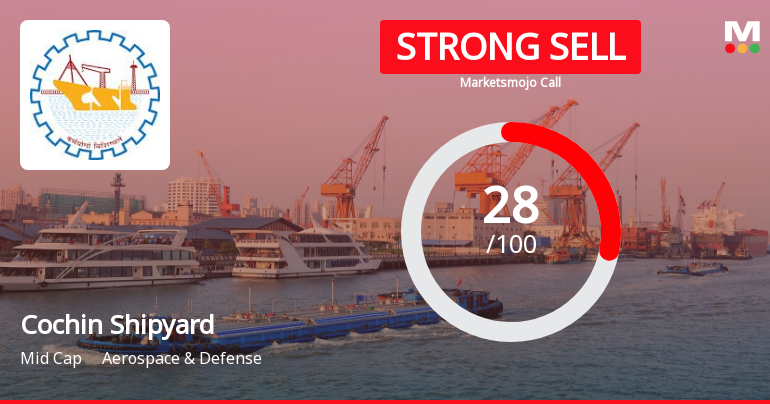
Cochin Shipyard Ltd is Rated Strong Sell
Cochin Shipyard Ltd is rated Strong Sell by MarketsMOJO, with this rating last updated on 07 July 2026. However, the analysis and financial metrics discussed here reflect the stock’s current position as of 19 July 2026, providing investors with the latest insights into the company’s performance and outlook.
Read full news article
Cochin Shipyard Ltd Sees Sharp Open Interest Surge Amid Bearish Momentum
Cochin Shipyard Ltd (COCHINSHIP) has witnessed a significant 11.1% rise in open interest in its derivatives segment, signalling heightened market activity despite the stock’s ongoing downward trend. This surge in open interest, coupled with increased volume and deteriorating price performance, suggests a complex interplay of investor positioning and potential directional bets amid a challenging sector environment.
Read full news article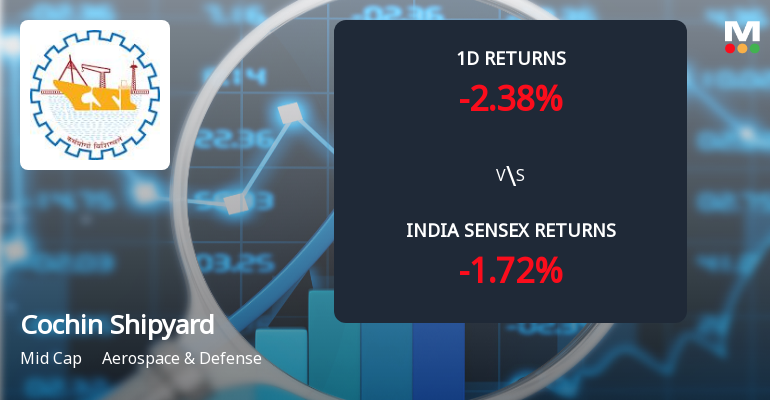
Cochin Shipyard Ltd Sees Sharp Open Interest Surge Amid Bearish Momentum
Cochin Shipyard Ltd (COCHINSHIP) has witnessed a notable 11.14% surge in open interest in its derivatives segment, signalling heightened market activity despite the stock’s ongoing downward trend. This increase in open interest, coupled with rising volumes and deteriorating price momentum, suggests a complex interplay of investor positioning and potential directional bets in the Aerospace & Defense sector.
Read full news article Announcements
Cochin Shipyard Limited - Investor Presentation
27-Nov-2019 | Source : NSECochin Shipyard Limited has informed the Exchange regarding Investor Presentation Highlights of Q2 2019-20
Cochin Shipyard Limited - Record Date
13-Nov-2019 | Source : NSECochin Shipyard Limited has informed the Exchange that the Company has fixed Record Date as November 22, 2019 for the purpose of Interim Dividend
Cochin Shipyard Limited - Acquisition
04-Nov-2019 | Source : NSECochin Shipyard Limited has informed the Exchange about Acquisition of balance 26% of equity shares in Hooghly Cochin Shipyard Limited (HCSL). With this acquisition of shares, HCSL has become a Wholly Owned Subsidiary of CSL with a paid up share capital of Rs.22 crores.
Corporate Actions

No Upcoming Board Meetings

Cochin Shipyard Ltd has declared 70% dividend, ex-date: 03 Feb 26

Cochin Shipyard Ltd has announced 5:10 stock split, ex-date: 10 Jan 24

No Bonus history available

No Rights history available
Quality key factors
Valuation key factors
Technicals key factors
 Technical Indicator Scale: Bearish, Mildly Bearish, Sideways, Mildly Bullish, Bullish Turned
 Shareholding Snapshot : Mar 2026
Shareholding Compare (%holding)
Promoters
None
Held by 24 Schemes (2.07%)
Held by 118 FIIs (3.1%)
President Of India (67.91%)
Life Insurance Corporation Of India (3.34%)
20.39%
Quarterly Results Snapshot (Consolidated) - Mar'26 - YoY

YoY Growth in quarter ended Mar 2026 is -15.55% vs 36.67% in Mar 2025
YoY Growth in quarter ended Mar 2026 is -3.73% vs 10.94% in Mar 2025
Half Yearly Results Snapshot (Consolidated) - Sep'25
Growth in half year ended Sep 2025 is 14.23% vs 28.71% in Sep 2024
Growth in half year ended Sep 2025 is -18.67% vs 29.62% in Sep 2024
Nine Monthly Results Snapshot (Consolidated) - Dec'25
YoY Growth in nine months ended Dec 2025 is 15.52% vs 20.37% in Dec 2024
YoY Growth in nine months ended Dec 2025 is -18.54% vs 2.97% in Dec 2024
Annual Results Snapshot (Consolidated) - Mar'26
YoY Growth in year ended Mar 2026 is 4.19% vs 25.83% in Mar 2025
YoY Growth in year ended Mar 2026 is -13.37% vs 5.62% in Mar 2025
About Cochin Shipyard Ltd

Company Coordinates


