
Compare Kinetic Trust with Similar Stocks
Stock DNA
Non Banking Financial Company (NBFC)
INR 12 Cr (Micro Cap)
31.00
21
0.00%
6.86
3.60%
2.96
Total Returns (Price + Dividend) 
Kinetic Trust for the last several years.
Risk Adjusted Returns v/s
Returns Beta

News

Kinetic Trust Ltd Downgraded to Strong Sell Amid Technical Weakness and Valuation Concerns
Kinetic Trust Ltd, a micro-cap player in the Non Banking Financial Company (NBFC) sector, has seen its investment rating downgraded from Sell to Strong Sell as of 18 Jun 2026. This shift reflects a deterioration in technical indicators alongside persistent fundamental weaknesses, despite the stock’s recent price appreciation and strong long-term returns relative to the Sensex.
Read full news articleAre Kinetic Trust Ltd latest results good or bad?
Kinetic Trust Ltd's latest financial results for Q3 FY26 indicate a notable operational turnaround, as the company reported a net profit of ₹0.14 crores, a shift from the losses experienced in the previous quarter. Revenue also saw a significant sequential increase, rising to ₹0.57 crores, which is more than double the ₹0.28 crores recorded in Q2 FY26. This growth in revenue reflects a dramatic recovery from prior declines, although the overall revenue trajectory has been volatile due to the company's micro-cap status. The operating margin for the quarter stood at a high 89.47%, showing an improvement from the previous quarter, while the profit after tax (PAT) margin expanded to 24.56%, a substantial recovery from negative figures in the prior quarter. Despite these positive operational metrics, the company faces ongoing challenges, including a high debt-to-equity ratio of 3.80x and a return on equity (ROE...
Read full news article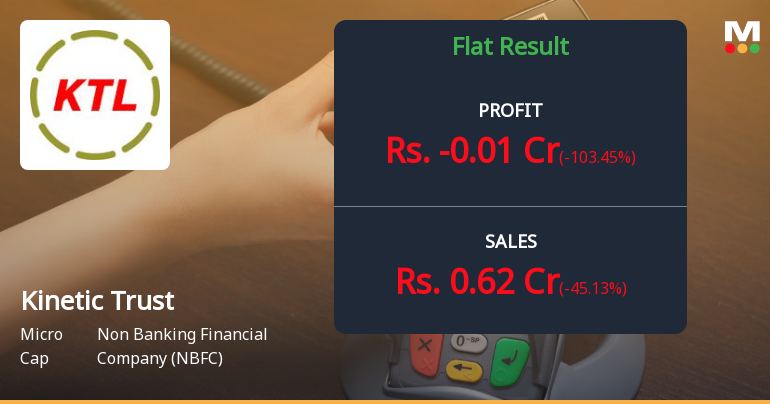
Kinetic Trust Q4 FY26: Micro-Cap NBFC Slips into Loss Despite Revenue Surge
Kinetic Trust Ltd., a micro-cap non-banking financial company (NBFC) with a market capitalisation of ₹14.00 crores, reported a loss of ₹0.01 crores for Q4 FY26 (March 2026 quarter), marking a sharp reversal from the ₹0.14 crores profit posted in the previous quarter. The company's stock closed at ₹42.39 on April 30, 2026, trading 44.09% below its 52-week high of ₹75.82, as investors grappled with deteriorating profitability despite robust revenue growth.
Read full news article Announcements
Board Meeting Outcome for Board Meeting Held On Monday 1St June 2026 For Appointment Of Company Secretary And Compliance Officer
01-Jun-2026 | Source : BSEAppointment of Ms. Pooja Aggarwal as Company Secretary & Compliance Officer of the company w.e.f 1st June 2026.
Appointment of Company Secretary and Compliance Officer
01-Jun-2026 | Source : BSEAppointment of Ms. Pooja Agarwal as Company Secretary & Compliance Officer of the company w.e.f 1st June 2026.
Announcement under Regulation 30 (LODR)-Award_of_Order_Receipt_of_Order
18-May-2026 | Source : BSEPursuant to Regulation 30 read with Schedule III of the SEBI (Listing Obligations and Disclosure Requirements) Regualtions 2015 we wish to inform you that the Honble National Company Law Tribunal Prayagraj Bench has approved the Resolution Plan submitted by Kinetic Trust Limited to Resolution professional in the CIRP of Sibri Traders Private Limited.
Corporate Actions

No Upcoming Board Meetings

No Dividend history available

No Splits history available

No Bonus history available

No Rights history available
Quality key factors
Valuation key factors
Technicals key factors
 Technical Indicator Scale: Bearish, Mildly Bearish, Sideways, Mildly Bullish, Bullish Turned
 Shareholding Snapshot : Mar 2026
Shareholding Compare (%holding)
Promoters
None
Held by 0 Schemes
Held by 0 FIIs
Sarbjit Singh (16.24%)
None
25.57%
Quarterly Results Snapshot (Standalone) - Mar'26 - YoY
Not Applicable: The company has declared_date for only one period
Not Applicable: The company has declared_date for only one period
Half Yearly Results Snapshot (Standalone) - Sep'24
Growth in half year ended Sep 2024 is 0.00% vs 0.00% in Sep 2023

Growth in half year ended Sep 2024 is -57.14% vs 12.50% in Sep 2023
Nine Monthly Results Snapshot (Standalone) - Dec'24
YoY Growth in nine months ended Dec 2024 is 0.00% vs 0.00% in Dec 2023

YoY Growth in nine months ended Dec 2024 is 8.33% vs -9.09% in Dec 2023
Annual Results Snapshot (Standalone) - Mar'26
YoY Growth in year ended Mar 2026 is 48.31% vs 337.04% in Mar 2025
YoY Growth in year ended Mar 2026 is -16.67% vs 280.00% in Mar 2025
About Kinetic Trust Ltd

Company Coordinates


