
Compare Shyam Century with Similar Stocks
Dashboard
With a Operating Losses, the company has a Weak Long Term Fundamental Strength
- The company has been able to generate a Return on Equity (avg) of 9.91% signifying low profitability per unit of shareholders funds
The company has declared Negative results for the last 5 consecutive quarters
Risky - Negative EBITDA
Consistent Underperformance against the benchmark over the last 3 years
Stock DNA
Ferrous Metals
INR 106 Cr (Micro Cap)
NA (Loss Making)
24
0.00%
-0.06
-5.60%
0.64
Total Returns (Price + Dividend) 
Latest dividend: 0.29860465116279067 per share ex-dividend date: Aug-23-2022
Risk Adjusted Returns v/s
Returns Beta

News
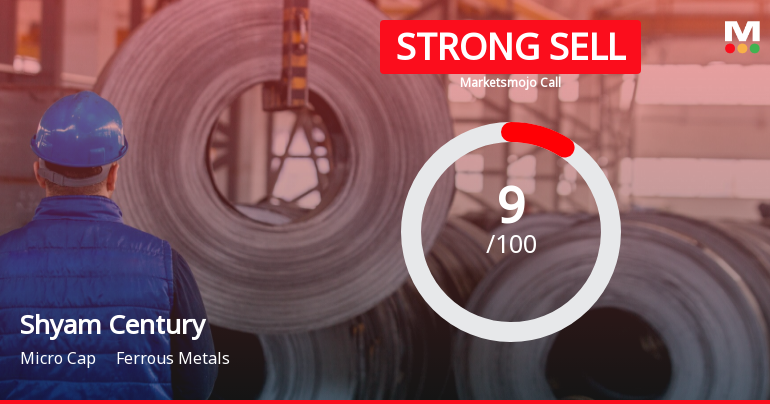
Shyam Century Ferrous Ltd is Rated Strong Sell
Shyam Century Ferrous Ltd is rated Strong Sell by MarketsMOJO, with this rating last updated on 11 May 2026. However, the analysis and financial metrics discussed here reflect the company’s current position as of 16 June 2026, providing investors with the latest insights into its performance and outlook.
Read full news article
Shyam Century Ferrous Ltd is Rated Strong Sell
Shyam Century Ferrous Ltd is rated Strong Sell by MarketsMOJO, with this rating last updated on 11 May 2026. However, the analysis and financial metrics discussed here reflect the company’s current position as of 04 June 2026, providing investors with the latest insights into its performance and outlook.
Read full news article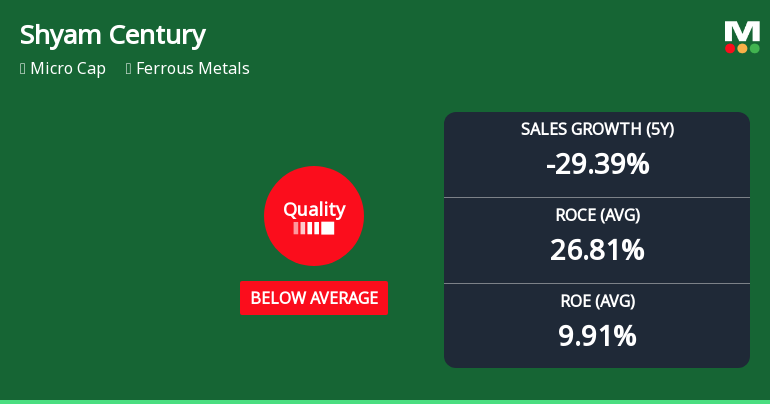
Shyam Century Ferrous Ltd Downgraded to Below Average Quality Amid Deteriorating Fundamentals
Shyam Century Ferrous Ltd, a micro-cap player in the ferrous metals sector, has seen its quality grade downgraded from average to below average as of 11 May 2026. This revision reflects deteriorating business fundamentals, including significant declines in sales and earnings growth, alongside mixed returns on capital and equity. The company’s financial health and operational consistency have come under scrutiny amid a challenging industry backdrop and underperformance relative to benchmark indices.
Read full news article Announcements
Compliances-Reg.24(A)-Annual Secretarial Compliance
28-May-2026 | Source : BSEAnnual Secretarial Compliance Report under Regulation 24A of the SEBI (Listing Obligations & Disclosure Requirements) Regulations 2015 is enclosed herewith
Announcement under Regulation 30 (LODR)-Newspaper Publication
23-May-2026 | Source : BSENewspaper Publication for the Audited Financial Results for the Quarter and Year ended 31st March 2026
Board Meeting Outcome for Outcome Of Board Meeting Held On 22Nd May 2026
22-May-2026 | Source : BSEFurther to our letter dated 11th May 2026 and as per recommendation made by the Audit Committee the Board of Directors of the Company at their duly convened meeting held today i.e. 22nd May 2026 inter alia has approved and taken on record the Audited Financial Results of the Company for the fourth quarter and year ended 31st March 2026. A copy of the Audited financial results of the Company for the fourth quarter and year ended 31st March 2026 along with Un-modified Statutory Auditors Reports are enclosed herewith and marked as Annexure for your information and record.
Corporate Actions

No Upcoming Board Meetings

Shyam Century Ferrous Ltd has declared 30% dividend, ex-date: 23 Aug 22

No Splits history available

No Bonus history available

No Rights history available
Quality key factors
Valuation key factors
Technicals key factors
 Technical Indicator Scale: Bearish, Mildly Bearish, Sideways, Mildly Bullish, Bullish Turned
 Shareholding Snapshot : Mar 2026
Shareholding Compare (%holding)
Non Institution
None
Held by 0 Schemes
Held by 1 FIIs (0.0%)
Brijdham Merchants Pvt Ltd (7.8%)
Subham Buildwell Private Limited (13.13%)
31.73%
Quarterly Results Snapshot (Standalone) - Mar'26 - QoQ

QoQ Growth in quarter ended Mar 2026 is -83.33% vs -88.38% in Dec 2025
QoQ Growth in quarter ended Mar 2026 is 103.26% vs -867.50% in Dec 2025
Half Yearly Results Snapshot (Standalone) - Sep'25

Growth in half year ended Sep 2025 is -63.27% vs -11.00% in Sep 2024
Growth in half year ended Sep 2025 is 35.40% vs -506.50% in Sep 2024
Nine Monthly Results Snapshot (Standalone) - Dec'25
YoY Growth in nine months ended Dec 2025 is -75.53% vs -6.51% in Dec 2024
YoY Growth in nine months ended Dec 2025 is -89.68% vs -303.29% in Dec 2024
Annual Results Snapshot (Standalone) - Mar'26
YoY Growth in year ended Mar 2026 is -80.20% vs -18.06% in Mar 2025
YoY Growth in year ended Mar 2026 is 1.50% vs -1,375.34% in Mar 2025
About Shyam Century Ferrous Ltd

Company Coordinates


