
Compare Shyam Century with Similar Stocks
Dashboard
With a Operating Losses, the company has a Weak Long Term Fundamental Strength
- The company has been able to generate a Return on Equity (avg) of 9.91% signifying low profitability per unit of shareholders funds
The company has declared Negative results for the last 5 consecutive quarters
Risky - Negative EBITDA
Consistent Underperformance against the benchmark over the last 3 years
Stock DNA
Ferrous Metals
INR 118 Cr (Micro Cap)
NA (Loss Making)
64
0.00%
-0.06
-5.60%
0.69
Total Returns (Price + Dividend) 
Latest dividend: 0.29860465116279067 per share ex-dividend date: Aug-23-2022
Risk Adjusted Returns v/s
Returns Beta

News
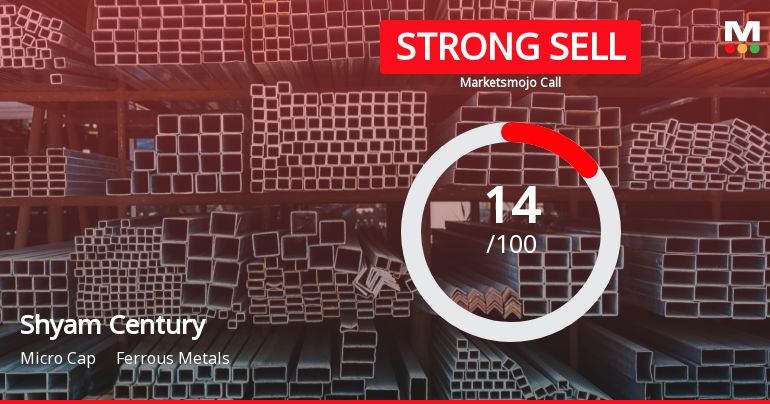
Shyam Century Ferrous Ltd is Rated Strong Sell
Shyam Century Ferrous Ltd is rated Strong Sell by MarketsMOJO, with this rating last updated on 11 May 2026. However, the analysis and financial metrics discussed here reflect the company’s current position as of 08 July 2026, providing investors with an up-to-date view of its fundamentals, valuation, financial trend, and technical standing.
Read full news article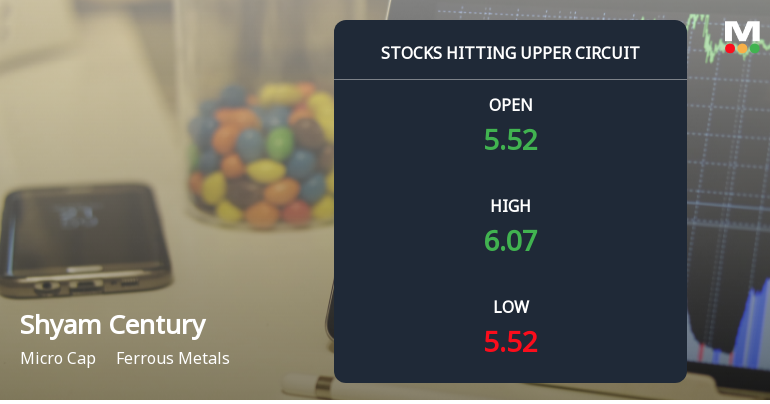
Shyam Century Ferrous Ltd Locks at Upper Circuit With 9.98% Gain — Buyers Queue, Sellers Absent
At Rs 6.06, the buying was done — not because demand dried up, but because the exchange wouldn't let the stock go any higher. Shyam Century Ferrous Ltd locked at its upper circuit of 9.98% on 30 Jun 2026, with buyers queuing and no sellers willing to part with shares.
Read full news article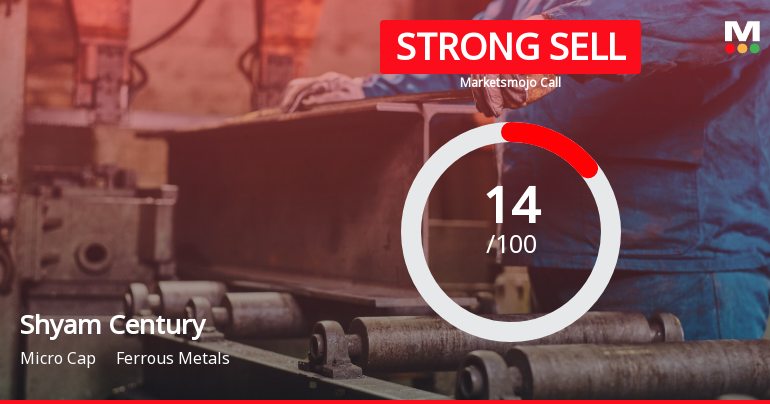
Shyam Century Ferrous Ltd is Rated Strong Sell
Shyam Century Ferrous Ltd is rated Strong Sell by MarketsMOJO. This rating was last updated on 11 May 2026, reflecting a reassessment of the stock’s outlook. However, all fundamentals, returns, and financial metrics discussed here are current as of 27 June 2026, providing investors with the latest view of the company’s position.
Read full news article Announcements
Compliances-Certificate under Reg. 74 (5) of SEBI (DP) Regulations 2018
09-Jul-2026 | Source : BSECompliance Certificate under Reg 74(5) of SEBI (DP) Reg 2018
Closure of Trading Window
24-Jun-2026 | Source : BSEIntimation of Closure of Trading Window
Compliances-Reg.24(A)-Annual Secretarial Compliance
28-May-2026 | Source : BSEAnnual Secretarial Compliance Report under Regulation 24A of the SEBI (Listing Obligations & Disclosure Requirements) Regulations 2015 is enclosed herewith
Corporate Actions

No Upcoming Board Meetings

Shyam Century Ferrous Ltd has declared 30% dividend, ex-date: 23 Aug 22

No Splits history available

No Bonus history available

No Rights history available
Quality key factors
Valuation key factors
Technicals key factors
 Technical Indicator Scale: Bearish, Mildly Bearish, Sideways, Mildly Bullish, Bullish Turned
 Shareholding Snapshot : Mar 2026
Shareholding Compare (%holding)
Non Institution
None
Held by 0 Schemes
Held by 1 FIIs (0.0%)
Brijdham Merchants Pvt Ltd (7.8%)
Subham Buildwell Private Limited (13.13%)
31.73%
Quarterly Results Snapshot (Standalone) - Mar'26 - QoQ

QoQ Growth in quarter ended Mar 2026 is -83.33% vs -88.38% in Dec 2025
QoQ Growth in quarter ended Mar 2026 is 103.26% vs -867.50% in Dec 2025
Half Yearly Results Snapshot (Standalone) - Sep'25

Growth in half year ended Sep 2025 is -63.27% vs -11.00% in Sep 2024
Growth in half year ended Sep 2025 is 35.40% vs -506.50% in Sep 2024
Nine Monthly Results Snapshot (Standalone) - Dec'25
YoY Growth in nine months ended Dec 2025 is -75.53% vs -6.51% in Dec 2024
YoY Growth in nine months ended Dec 2025 is -89.68% vs -303.29% in Dec 2024
Annual Results Snapshot (Standalone) - Mar'26
YoY Growth in year ended Mar 2026 is -80.20% vs -18.06% in Mar 2025
YoY Growth in year ended Mar 2026 is 1.50% vs -1,375.34% in Mar 2025
About Shyam Century Ferrous Ltd

Company Coordinates


